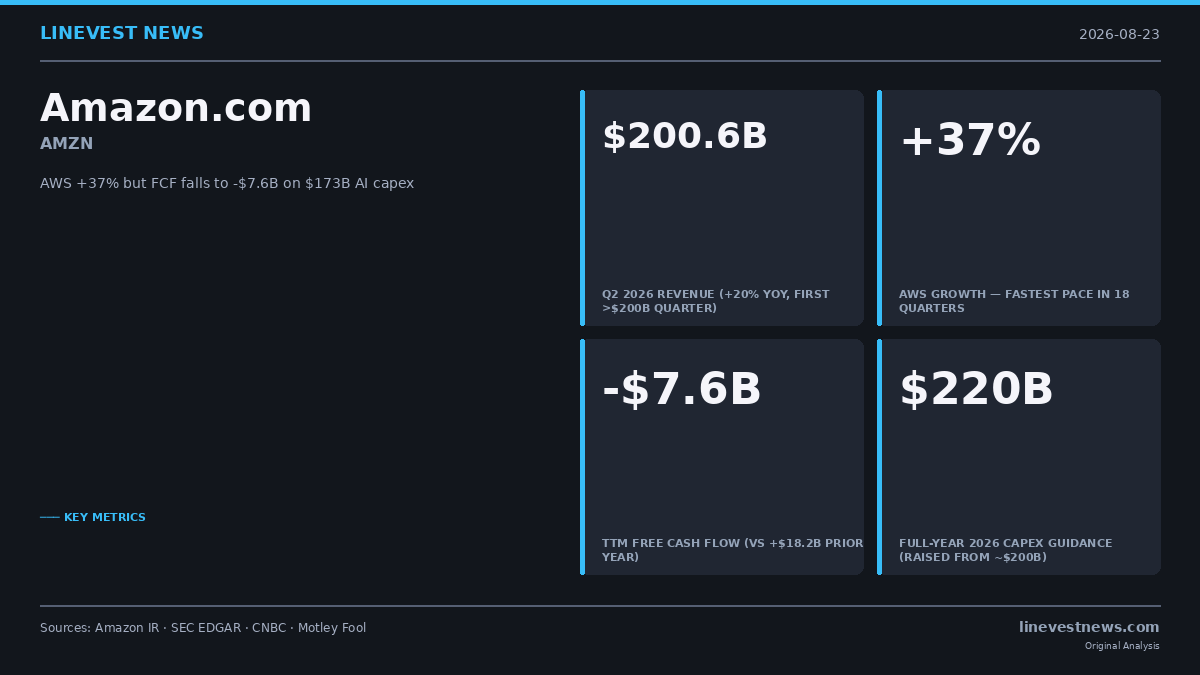
TL;DR - Amazon Q2 2026: record Q2 revenue $200.6B (+20% YoY) - AWS accelerated to $42.2B (+37% YoY), fastest growth in 18 quarters, ~39.3% operating margin - GAAP net income $62.6B: approximately $41B was after-tax non-operating investment gains (primarily Anthropic); approximately $21B was attributable to operating businesses (after tax) - Trailing-12-month (TTM) free cash flow: −$7.6B (vs. +$18.2B one year earlier — a YoY shift of $25.8B) - TTM gross property/equipment purchases: $173B (+64%); net of asset sale proceeds: ~$169B - Full-year 2026 capex guidance raised to ~$220B (from ~$200B) - Long-term debt nearly doubled to $128.9B (from $65.6B at end-2025)
Part A — What Amazon Reported for Q2 2026
Amazon posted record second-quarter revenue of $200.6 billion, up approximately 20% from $167.7 billion in Q2 2025. Operating income as reported by segment totaled $27.4 billion (segments: $9.1B + $1.7B + $16.6B), expanding operating margin to approximately 13.7%.
Segment Summary
| Segment | Q2 2026 Revenue | YoY Growth | Operating Income |
|---|---|---|---|
| North America | $116.2B | ~+16% | $9.1B |
| International | $42.2B | ~+15% | $1.7B (+13%) |
| AWS | $42.2B | ~+37% | $16.6B (+63%) |
AWS grew 37% year-over-year — its fastest pace in 18 quarters — reaching an annualized run rate of $169 billion. AWS operating margin expanded to approximately 39.3% (from roughly 33% in Q2 2025), reflecting AI workload pricing and ongoing cost discipline.
CEO Andy Jassy noted that Amazon's AI and chips businesses each surpassed $25 billion annualized run rates, underscoring AI's growing contribution to real revenue.
GAAP Earnings — and What's Inside Them
GAAP diluted EPS came in at $5.75, versus $1.68 in Q2 2025. However, context is critical.
Amazon's GAAP net income of $62.6 billion includes approximately $53.4 billion in pre-tax non-operating income, primarily unrealized gains on Amazon's equity stake in Anthropic and other investments. These are paper gains — not cash received — and are subject to reversal. After applying the implied effective tax rate (~22.6%), the after-tax contribution of these non-operating gains to GAAP net income was approximately $41 billion, leaving roughly $21 billion attributable to Amazon's operating businesses ($62.6B − $41B ≈ $21B). That is a healthy result, but very different from the $62.6 billion headline.
Q3 2026 Guidance
Amazon guided Q3 2026 net sales to $197.0–$202.0 billion and operating income to $22.5–$26.5 billion, absorbing approximately 80 basis points of foreign-exchange headwind. The guidance midpoint of $199.5 billion represents a modest step-down from Q2's $200.6 billion, which management primarily attributed to FX. Amazon does not provide a specific organic-growth breakdown for its guidance.
Part B — The Cash Flow Gap That Capex Is Creating
Free Cash Flow: A $25.8B Year-Over-Year Shift
Amazon's core operations remain healthy. Trailing-twelve-month (TTM) operating cash flow rose 33% to $161.4 billion, driven by AWS margin expansion and improving North America retail economics.
But Amazon's reported free cash flow — defined as operating cash flow minus purchases of property and equipment net of proceeds from sales and incentives — tells a different story. Over the TTM period ending June 30, 2026, gross property and equipment purchases totaled approximately $173 billion (+64% year-over-year). After netting out asset sale proceeds, the capex figure used in Amazon's FCF calculation was roughly $169 billion, yielding TTM free cash flow of −$7.6 billion — compared with +$18.2 billion one year earlier. That $25.8 billion year-over-year shift reflects how capital spending has outpaced operating cash generation over the past twelve months.
Raising the Target: ~$220 Billion in 2026
Rather than moderating spending, Amazon raised its full-year 2026 cash capex guidance to approximately $220 billion, up from the roughly $200 billion it projected earlier. Jassy attributed the increase to higher memory chip costs, reflecting competition among hyperscalers for advanced DRAM and HBM capacity.
On a TTM basis, Amazon's net capex ($169 billion) already exceeds operating cash flow ($161.4 billion) at a net-capex-to-OCF ratio of approximately 1.05x. Gross capex ($173 billion) against OCF gives 1.07x. Against full-year guidance of $220 billion and current TTM OCF of $161.4 billion, the forward ratio rises to approximately 1.36x — meaning even a meaningful increase in OCF over the next year would leave free cash flow in negative territory.
Debt as the Bridge
When capital expenditures consistently outpace operating cash generation, companies must borrow to fund the gap. Amazon has done exactly that.
Long-term debt nearly doubled in six months — from $65.6 billion at end-2025 to $128.9 billion as of June 30, 2026 — an increase of approximately $63 billion. Issuing investment-grade debt to build infrastructure is a rational financing strategy if the returns materialize. But at this scale, rising interest expense becomes a meaningful earnings headwind, particularly if rates remain elevated or AI revenue timelines slip.
Investor Framework: Three Things to Watch
1. TTM Free Cash Flow Trend GAAP earnings are distorted by non-operating mark-to-market swings; TTM FCF is the cleanest measure of whether the capital investment is paying for itself. Watch whether the negative FCF gap narrows as the capex ramp stabilizes in late 2026 and 2027.
2. AWS Margin Trajectory At approximately 39.3%, AWS operating margin is already strong. The bull case requires it to move toward the mid-40s as AI workloads — which carry higher revenue per unit than traditional cloud — scale. Stalling margin expansion would weaken the capital efficiency argument.
3. Non-Operating Investment Gains The approximately $41 billion in after-tax non-operating income in Q2 is tied primarily to private-market marks on Anthropic and other investments. Should those valuations be revised downward, GAAP earnings would reverse sharply — potentially confusing investors anchored to the current EPS headline.
Is Amazon Alone in This Trend?
No, but it is the most extreme case among public hyperscalers. Microsoft, Alphabet, and Meta have all increased AI-related capital spending in 2026 and all face some free cash flow compression. Amazon's TTM gross capex of $173 billion is substantially larger than any peer's, reflecting both AWS's scale and Amazon's decision to invest at the infrastructure frontier rather than rely on third-party providers.
This creates a credible long-term moat argument — physical AI infrastructure may confer structural pricing power as compute demand compounds. But it also means Amazon's near-term FCF pressure is uniquely large, and the payoff timeline is measured in years, not quarters.
This article is for informational purposes only and does not constitute investment advice. LineVest is not a registered investment adviser.