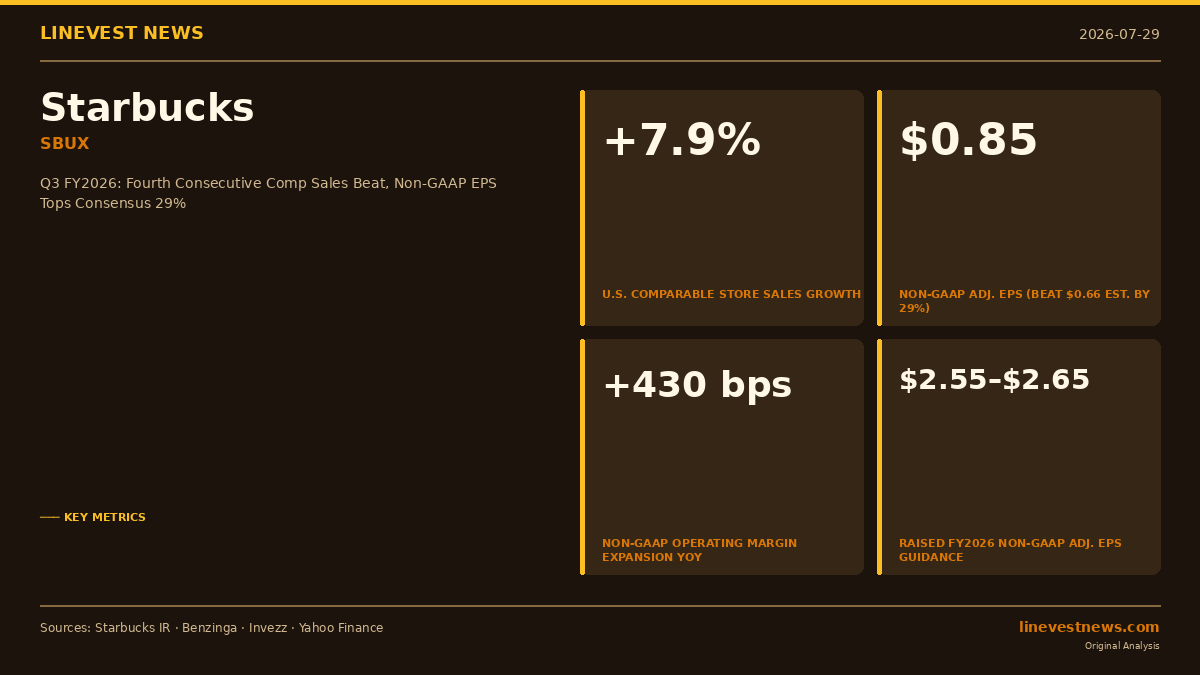
TL;DR - Starbucks' fiscal third quarter (ended June 28, 2026) delivered U.S. comparable store sales of +7.9% and North America comps of +8.1% — the fourth consecutive quarter of positive comps under CEO Brian Niccol's "Back to Starbucks" plan. - Non-GAAP adjusted EPS hit $0.85, beating the $0.66 consensus by 29%; non-GAAP operating margin expanded 430 basis points year over year to 14.4%. - GAAP EPS ($0.91) exceeded non-GAAP EPS ($0.85): approximately $362M of restructuring charges are included in GAAP operating income but excluded from non-GAAP, while a one-time gain from the China JV formation is included in GAAP net income but excluded from non-GAAP. - Full-year FY2026 guidance was raised: non-GAAP EPS now $2.55–$2.65 (from $2.25–$2.45), and global comparable sales are projected to grow approximately 6%.
Q3 FY2026 Financial Summary (ended June 28, 2026)
| Metric | Q3 FY2026 | Q3 FY2025 | Change |
|---|---|---|---|
| Net Revenues | $9.32B | $9.46B | ~-1.5% |
| GAAP Operating Income | $980.4M | $935.6M | +4.8% |
| GAAP Net Income | $1,045.3M | $558.3M | +87.2% |
| GAAP EPS (diluted) | $0.91 | $0.49 | +85.7% |
| Non-GAAP EPS (diluted) | $0.85 | $0.50 | +70.0% |
| GAAP Operating Margin | 10.5% | 9.9% | +60 bps |
| Non-GAAP Operating Margin | 14.4% | 10.1% | +430 bps |
GAAP vs. Non-GAAP: Approximately $362M of restructuring charges are included in GAAP operating income but excluded from non-GAAP — this is why non-GAAP operating margin (14.4%) is higher than GAAP (10.5%). Separately, GAAP net income ($1,045.3M) exceeds GAAP operating income ($980.4M) because a one-time non-operating gain from the China JV transaction more than offset interest expense and income taxes. That same China JV gain is excluded from non-GAAP results, explaining why GAAP EPS ($0.91) is higher than non-GAAP EPS ($0.85) even though GAAP operating margin is lower.
Comparable Store Sales
| Region | Comp Sales Growth | Transactions | Avg. Ticket |
|---|---|---|---|
| North America | +8.1% | +4.5% | +3.5% |
| United States | +7.9% | +4.2% | +3.6% |
| International | +5.7% | +2.6% | +3.1% |
Management also reported global comparable sales of +7.9% for Q3. Canada's performance within North America is not separately disclosed. Components within each region may not sum exactly due to rounding.
Segment Operating Margins
| Segment | Op. Margin Q3 FY26 | Op. Margin Q3 FY25 | Change |
|---|---|---|---|
| North America | 13.6% | 13.3% | +30 bps |
| International | 19.1% | 13.6% | +550 bps |
| Channel Development | 52.1% | 45.1% | +700 bps |
Store Count: 41,304 total (175 net new in Q3); 16,933 in the U.S.; 33% company-operated, 67% licensed.
Updated FY2026 Guidance
| Metric | Prior Guidance | Raised Guidance |
|---|---|---|
| Non-GAAP EPS | $2.25–$2.45 | $2.55–$2.65 |
| Non-GAAP Operating Margin | >10.0% | >11.0% (floor) |
| U.S. Comparable Store Sales (FY) | ~5.5%+ | ~6.0%+ |
| Global Comparable Store Sales | ~5.5% | ~6.0% |
| Net New Coffeehouse Locations | 600–650 | 600–650 (unchanged) |
Full-year non-GAAP operating margin floor of >11.0% reflects blending with earlier quarters before the China accounting change; Q3 alone ran at 14.4%.
Analysis: When "Back to Starbucks" Stopped Being a Slogan
The Revenue Decline and China Accounting Shift
Revenue declined approximately 1.5% to $9.32 billion. This almost entirely reflects a structural accounting change: beginning in Q3 FY2026, Starbucks deconsolidated its China retail business after forming a joint venture in which it holds a 40% economic interest. Nearly 7,700 company-operated stores in China — previously generating consolidated restaurant revenues — were removed from Starbucks' income statement. China restaurant sales no longer appear in top-line revenue; instead, Starbucks records its 40% share of JV earnings within the International segment's operating income as "income from equity investees." This shift — JV equity income replacing direct restaurant revenues and cost structures — is the primary driver of International segment operating margins surging +550 basis points to 19.1%.
The one-time non-operating gain from the China JV transaction itself is excluded from non-GAAP results but flows through GAAP, explaining why GAAP net income ($1,045.3M) exceeds GAAP operating income ($980.4M) and why GAAP EPS ($0.91) is above non-GAAP EPS ($0.85).
Four Consecutive Quarters of Positive Comparable Sales
Comparable store sales growth — particularly the transaction component — is a more robust signal than EPS alone. Ticket-driven comps (pure average-price increases) are more fragile; transaction growth requires customers to actually show up more often.
Starbucks delivered: - North America transactions +4.5% and International transactions +2.6%: real customer traffic gains across both segments - Average ticket growth of +3.1% to +3.6% by region: a healthy mix of menu pricing and higher-complexity orders
During 2024 and through mid-2025, Starbucks posted consistent traffic declines — customers were trading down or choosing competitors such as Dutch Bros and local independent cafés. CEO Niccol's operational fixes (simplifying menus, cutting wait times, restaffing peak-hour baristas, and reintroducing in-store personalization) appear to be reversing that trend. "This was the quarter our momentum became truly measurable," Niccol stated on the earnings call.
Niccol's Structural Playbook
Brian Niccol joined as CEO in September 2024, recruited from Chipotle Mexican Grill (CMG), where he oversaw one of the most successful quick-service restaurant turnarounds of the past decade. His "Back to Starbucks" strategy centers on three pillars:
- Experience: Reducing wait times, improving in-store ambiance, reintroducing personal cup labeling.
- Coffee quality: Refocusing on handcrafted espresso drinks rather than heavily customized, sugar-forward beverages.
- Labor investment: Staffing improvements at peak hours to reduce mobile order backlogs.
What the Non-GAAP Margin Expansion Signals
Non-GAAP operating margin expanding 430 basis points to 14.4% reflects both add-backs of restructuring charges (~$362M) and genuine operational improvement. The GAAP operating margin expanded a more conservative +60 bps to 10.5%, as restructuring charges remain in GAAP results.
Channel Development — Starbucks' at-home and packaged goods business sold through grocery retailers — posted 52.1% operating margins, up 700 basis points from 45.1%, on revenue of $587.9M in Q3, demonstrating that the brand's pull-through in retail channels is strengthening alongside the café recovery.
North America's 13.6% segment operating margin remains well below pre-2020 historical highs that exceeded 20%, suggesting meaningful room for further expansion as the turnaround matures.
Analyst Reaction and Stock Performance
Wall Street raised price targets following the report:
| Firm | Rating | Prior Target | New Target |
|---|---|---|---|
| Bank of America | Buy | $137 | $143 |
| DA Davidson | Neutral | $102 | $110 |
SBUX shares gained approximately +6% in pre-market trading on July 30, settling around $108.18 (+3.88%) during the session and reaching a 52-week high. The stock had been range-bound near $90–$100 through much of Niccol's first year, making the breakout a notable milestone.
At approximately $108.18, SBUX trades at roughly 41.6× the midpoint of updated FY2026 non-GAAP EPS guidance ($2.60), a premium multiple that prices in continued execution on the turnaround narrative.
Key Risks to Monitor
China JV transparency: With China deconsolidated, revenue visibility into the world's second-largest Starbucks market is reduced. JV equity earnings flow as a single line within International operating income — less transparency on unit economics, traffic trends, and pricing in a market where domestic competitors such as Luckin Coffee have aggressively gained share.
Japan concentration: Japan is now Starbucks' largest company-operated international market. A downturn in Japanese consumer sentiment or significant yen depreciation would have outsized impact on International results.
North America margin trajectory: NA operating margin (13.6%) remains well below pre-2020 highs above 20%. Absorbing ongoing labor cost increases while sustaining comparable sales growth is the core challenge through FY2027.
Premium positioning durability: If the U.S. consumer weakens materially, the comparable sales recovery may decelerate — particularly among younger, value-conscious customers who previously shifted to lower-price alternatives.
Investor Perspective
Q3 FY2026 provides the clearest validation yet that Niccol's "Back to Starbucks" plan is working. Four consecutive quarters of positive comparable sales — after a prolonged stretch of traffic declines — marks a genuine reversal in the brand's trajectory.
The China JV pivot simultaneously reduces geopolitical exposure and capital intensity, though it comes with reduced disclosure. Non-GAAP margin expansion of 430 bps (GAAP: +60 bps) captures both restructuring add-backs and genuine operational gains; the cleaner signal of structural improvement is the North America segment's 30 bps GAAP expansion achieved while increasing labor investment.
Bulls (BofA, $143 target) see a multi-year margin recovery story with upside from China optionality as the JV matures. Skeptics (DA Davidson, Neutral, $110) see limited near-term upside at 41.6× FY2026 non-GAAP EPS. The critical variable for the next two quarters is whether comparable sales growth holds as the U.S. consumer environment becomes less certain.
This article is for informational purposes only and does not constitute investment advice or a recommendation to buy or sell any security.
Sources - Starbucks Q3 FY2026 Press Release — investor.starbucks.com - Starbucks Stock Climbs After Q3 Beat — Benzinga - Starbucks Stock Jumps 6% After Beat, Wall Street Hikes PT — Invezz - StockTitan — Starbucks Q3 FY2026 Report - Yahoo Finance — Starbucks Q3 Earnings Call Highlights - GuruFocus — Starbucks Q3 FY2026 Raises EPS Guidance