
Lotte Tour Development (032350.KS) Q1 2026: Casino Revenue Surges 40%, Operating Profit Doubles as Net Loss Narrows 69%
Jeju Dream Tower's foreign-only casino is now generating three-quarters of group revenue — and the structural leverage that once amplified losses is finally working in reverse.
Source: Q1 2026 Quarterly Report — Filed with DART | Consolidated Financial Statements | Unit: ₩ billions

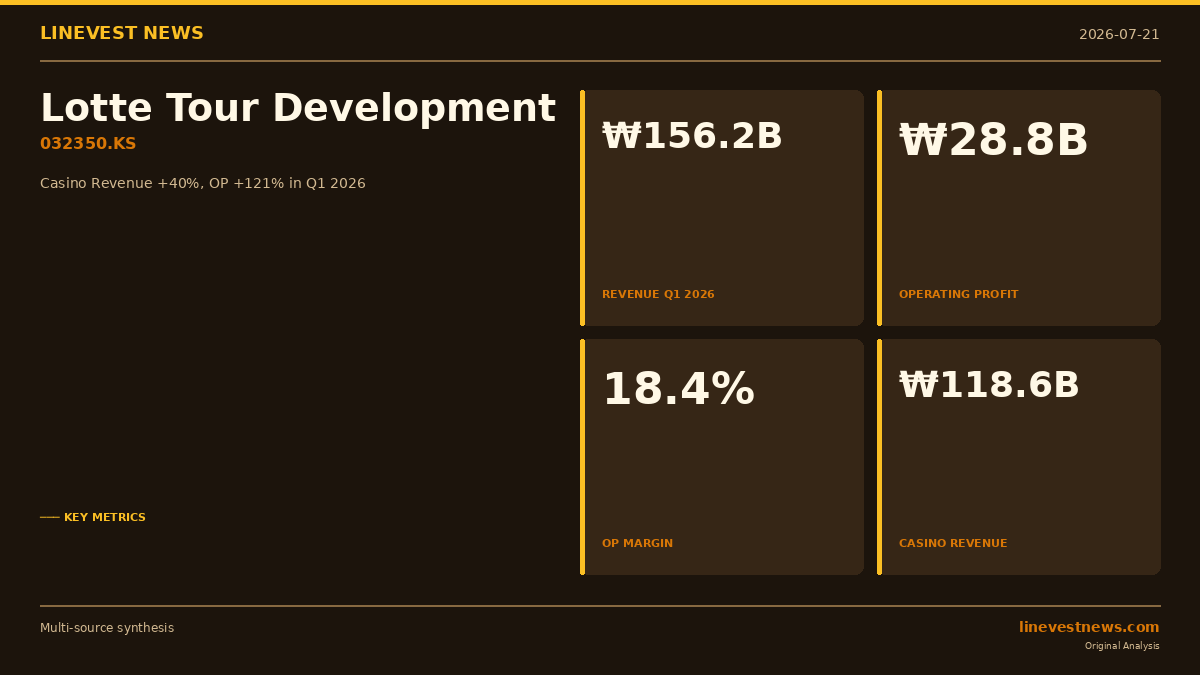
Lotte Tour Development delivered its most striking quarterly reversal in recent memory, posting Q1 2026 revenue of ₩156.18 billion (+28.1% year-over-year) and operating profit of ₩28.79 billion (+121.0% YoY), driven almost entirely by an explosive acceleration in the casino operations housed within its Jeju Dream Tower Integrated Resort. The casino subsidiary LT Entertainment recorded quarterly revenue of ₩118.63 billion — a 40.4% surge that pushed the segment's share of consolidated revenue to 75.96%, cementing its status as the group's singular growth engine. LT Entertainment's standalone quarterly net profit reached ₩31.94 billion, a figure that illustrates the underlying profitability of the casino floor itself. Yet the consolidated bottom line remains in negative territory: a net loss of ₩7.46 billion persisted in Q1 2026, held down by ₩35.41 billion in quarterly financial expenses — primarily interest charges on the ₩1.3 trillion debt stack assembled to finance Dream Tower's construction. Critically, that net loss has compressed by 68.5% from ₩23.69 billion in Q1 2025, placing the group on a trajectory where a full-year return to profitability is no longer a distant aspiration but a near-term calculus.
Balance Sheet
Asset Base: Capital-Intensive and Stable, With One Notable Inventory Signal
| Item | End-FY2025 (₩bn) | End-Q1 2026 (₩bn) | Change | Commentary |
|---|---|---|---|---|
| Cash & Cash Equivalents | 62.13 | 53.87 | -13.3% | Reduced by interest payments and lease obligations |
| Trade Receivables | 4.93 | 4.04 | -18.0% | Healthy collection; casino operations are largely cash-based |
| Inventories | 6.35 | 10.99 | +73.1% | Cruise vouchers & air tickets pre-purchased for peak season |
| Property, Plant & Equipment | 1,634.49 | 1,627.12 | -0.5% | Reflects ₩16.47bn depreciation; minimal new acquisitions |
| Intangible Assets | 46.27 | 46.23 | -0.1% | Goodwill of ₩42.52bn held steady |
Total assets stood at ₩2,151.2 billion at the end of Q1 2026, a modest 0.8% decline from year-end 2025. The balance sheet's defining characteristic is its capital intensity: PP&E accounts for 75.6% of total assets, reflecting the ₩1 trillion-plus infrastructure investment in the Dream Tower complex. Investors should note that a significant portion of that PP&E carrying value rests on revaluation surplus — the group has recognised ₩920.2 billion in property revaluation gains, an amount that exceeds total equity by a considerable margin. This inflates the asset base and warrants scrutiny if the Jeju real estate market softens.
The most operationally interesting balance sheet movement is the 73.1% jump in inventories, from ₩6.35 billion to ₩10.99 billion. The report discloses that cruise usage rights and airline tickets account for ₩6.07 billion of the quarter-end inventory balance. This pre-purchasing pattern is a deliberate forward-positioning move ahead of the summer travel peak, and it provides a forward-looking signal that the travel and leisure segment is being actively scaled into Q2 2026.
Liability Structure: Financial Liabilities Dominate, Debt Remains the Central Constraint
The liability side of the balance sheet is where the legacy of Dream Tower's construction financing remains most visible. Financial liabilities total approximately ₩1.3046 trillion, representing 72.8% of total liabilities of ₩1.7928 trillion. The composition is as follows:
- Long-term borrowings: ₩893.997 billion (up ₩10.955 billion from year-end 2025)
- Current convertible bonds: ₩85.516 billion
- Long-term lease liabilities: ₩290.553 billion
- Current lease liabilities: ₩34.486 billion
The increase in long-term borrowings during the quarter signals that the group is still in a net debt-accumulation phase rather than active deleveraging. Quarterly interest expense alone reached ₩27.29 billion, which annualises to approximately ₩109.1 billion — a fixed cash obligation that sits structurally above the current quarterly operating profit run-rate and will remain the primary obstacle to sustained net profitability.
Operating liabilities are comparatively modest: trade payables of ₩10.41 billion, accrued expenses of ₩98.51 billion, and customer deposits of ₩48.44 billion (the latter reflecting casino deposit balances, a normal feature of VIP gaming operations).
Capital Structure: A Deficit Reclassification That Carries a Strategic Message
Total equity of ₩358.47 billion stands against total liabilities of ₩1.7928 trillion, producing a debt-to-equity ratio that exceeds 500% — a leverage profile that is high by any standard measure. The equity base is composed of paid-in capital (₩39.80 billion) plus capital surplus (₩90.82 billion), offset by an accumulated deficit of -₩481.92 billion.
The most significant capital structure event in Q1 2026 was an accounting reclassification: ₩590.78 billion of capital surplus was transferred to offset the accumulated deficit, reducing it from -₩1,065.31 billion to -₩481.92 billion. No cash changed hands in this transaction. It is purely a rearrangement of equity line items. However, the strategic intent is transparent — by compressing the deficit balance, management is laying the accounting groundwork required before dividends can legally be declared. Under Korean commercial law, accumulated deficits must be eliminated before profit distributions are permitted. This move signals that management is positioning for an eventual dividend reinstatement, a development that would represent a watershed moment in the company's normalisation narrative.
Income Statement
Core Earnings Metrics
| Item | Q1 2025 (₩bn) | Q1 2026 (₩bn) | Change |
|---|---|---|---|
| Revenue | 121.95 | 156.18 | +28.1% |
| Operating Profit | 13.03 | 28.79 | +121.0% |
| Operating Margin | 10.7% | 18.4% | +7.7pp |
| Net Loss | -23.69 | -7.46 | Loss narrows 68.5% |
| Net Margin | -19.4% | -4.8% | +14.6pp |
Casino: A Structural Shift in the Revenue Mix
The revenue story is unambiguous. LT Entertainment's casino revenue of ₩118.63 billion in Q1 2026 was up 40.4% from ₩84.5 billion in Q1 2025, and the casino segment's share of consolidated revenue has followed a clear trajectory: 62.5% in FY2024, 72.9% in FY2025, and now 75.96% in Q1 2026. This is not a seasonal blip but a structural shift in the business mix as the resort's gaming floor matures and builds a recurring high-roller clientele.
The casino is a foreign-nationals-only operation, which means Chinese visitor arrivals are the dominant demand driver. The expansion of direct flight routes between mainland Chinese cities and Jeju Island is the single most important variable behind the Q1 acceleration. As Jeju's inbound air capacity from China continues to recover toward pre-pandemic levels, the casino's revenue base is benefiting from a supply-side tailwind that did not exist two years ago.
Operating Leverage: The 28%-to-121% Multiplier Effect
The relationship between revenue growth and operating profit growth in Q1 2026 provides a textbook illustration of operating leverage in a capital-heavy resort business. Revenue grew 28.1%; operating profit grew 121.0%. The multiplier of approximately 4.3x exists because the cost structure is overwhelmingly fixed: quarterly depreciation on PP&E runs at ₩16.47 billion, intangible amortisation adds ₩0.35 billion, and lease-related charges (right-of-use asset depreciation plus lease interest) recur every quarter regardless of occupancy levels. Variable costs — gaming commissions, food and beverage inputs, travel product costs — are real but secondary.
This cost architecture means the inflection point, once crossed, produces disproportionate profit improvement. With the group now operating above that inflection threshold, each incremental percentage point of revenue growth translates into a much larger percentage improvement in operating profit. The corollary, of course, is that the same leverage works brutally in reverse during a demand downturn.
The Gap Between Operating Profit and Net Profit
The ₩21.33 billion gap between operating profit (₩28.79 billion) and net loss (-₩7.46 billion) requires direct explanation. Financial expenses in Q1 2026 totalled ₩35.41 billion, comprising primarily ₩27.29 billion of interest on borrowings and ₩7.91 billion of lease interest. This financial cost burden is structurally embedded and will not reduce materially until principal repayments are made at scale. Until quarterly operating profit consistently exceeds ₩35 billion — approximately ₩6 billion above the Q1 2026 level — the group will continue to report net losses even as its operational performance improves.
Cash Flow
| Item | Q1 2025 (₩bn) | Q1 2026 (₩bn) | Change |
|---|---|---|---|
| Operating Cash Flow | 7.34 | -1.42 | -8.76 |
| Investing Cash Flow | -12.31 | -6.63 | +5.68 |
| Financing Cash Flow | -10.94 | -0.71 | +10.23 |
| Closing Cash Balance | 28.52 | 53.87 | +25.35 |
Operating Cash Flow: Surface Deterioration, Solid Underlying Generation
The headline shift from positive operating cash flow in Q1 2025 (₩7.34 billion) to negative in Q1 2026 (-₩1.42 billion) looks alarming at first glance but dissolves under scrutiny. Two items explain the apparent deterioration. First, interest paid in the quarter was ₩15.49 billion, a cash outflow that is classified within operating activities under K-IFRS and suppresses the reported figure. Second, working capital movements consumed ₩38.73 billion in Q1 2026, driven by the inventory build-up in cruise vouchers and airline tickets discussed earlier, combined with the settlement of prior-period payables. Stripping these out, the cash generated from operations before working capital and interest was ₩13.78 billion — a figure that demonstrates the underlying cash-generating quality of the resort operations remains intact and improving.
Investing Activities: CapEx Discipline Pays Off
Investing outflows halved year-over-year, from ₩12.31 billion in Q1 2025 to ₩6.63 billion in Q1 2026. PP&E additions of ₩4.99 billion were the primary component. The moderation in capital expenditure reflects the completion of Dream Tower's major construction phase — the group is now in a harvest mode rather than a build mode on its core asset, which is precisely the condition needed to convert operating profit into free cash flow.
Free cash flow (FCF), calculated as operating cash generated before working capital changes and interest of ₩13.78 billion, minus CapEx of ₩5.12 billion, yields approximately ₩8.66 billion for the quarter. While modest in absolute terms, this positive FCF confirms that the asset base is now capable of self-funding at a basic level.
Financing Activities: A Clean Quarter Without the Convertible Bond Drag
Financing outflows fell sharply to ₩0.71 billion in Q1 2026, compared to ₩10.94 billion in Q1 2025. The prior-year period included ₩11.27 billion of convertible bond repayments that did not recur. The absence of this one-time drain meaningfully improved the consolidated cash position, which ended the quarter at ₩53.87 billion versus ₩28.52 billion a year earlier. The higher closing cash balance provides somewhat more liquidity headroom against the recurring interest payment schedule.
Key Findings
The Deficit Reclassification and What It Signals About Management Intent
The transfer of ₩590.78 billion from capital surplus to accumulated deficit offset is the largest single accounting event of the quarter and arguably the most strategically significant. As noted, this is a non-cash reclassification — it does not improve liquidity, reduce debt, or affect earnings in any period. What it does is remove a structural barrier to dividend payments. Management would not undertake this accounting step unless they had a credible medium-term expectation of generating distributable retained earnings. In the context of Q1 2026's 68.5% reduction in net losses, the timing of the reclassification reinforces the view that leadership sees full-year profitability as achievable within the next two to four quarters.
Casino Concentration Risk: 76% Revenue Exposure to a Single, Exogenous Variable
The casino's growing dominance of the revenue mix is simultaneously the group's greatest strength and its most acute vulnerability. At 75.96% of consolidated revenue, the casino segment means that Lotte Tour Development's financial performance is now functionally a proxy for Chinese tourist arrivals at Jeju. Three variables outside management's control — PRC outbound travel policy, Jeju's direct flight capacity from Chinese cities, and the broader geopolitical temperature in cross-strait relations — can each independently cause material revenue swings. The 40% casino revenue growth in Q1 2026 is genuine and impressive, but the same exposure that amplified upside could produce a sharp reversal if any of these external conditions deteriorate.
Controlling Shareholder Restructuring: A Transition in Progress
The Q1 2026 report discloses a notable shift in the ownership register. Chairman Kim Ki-byung's stake has declined from 22.72% to 14.97%, a reduction of 7.75 percentage points, while Kim Han-jun's holding has risen sharply from 1.26% to 8.92%. The magnitude and directionality of these changes are consistent with a structured ownership succession or internal restructuring exercise rather than open-market trading. For institutional investors, a controlling shareholder transition of this scale warrants monitoring: changes in ultimate control can affect strategic priorities, capital allocation decisions, and the timeline for financial normalisation measures such as the dividend reinstatement groundwork already underway.
Dreamhub (Yongsan Development) Impairment: The Legacy Loss Is Fully Absorbed
The group previously carried exposure to the failed Yongsan development project through equity securities of ₩151.0 billion and debt securities of ₩22.65 billion. Both positions have been written down to zero through prior-period impairments. There is no remaining book value to impair, which eliminates a source of potential future write-down charges that had previously created downside uncertainty. The practical recovery value of these positions is effectively nil, but the elimination of impairment risk is a genuine clean-up of the loss statement's tail risks.
Revaluation Surplus: The ₩920.2 Billion Number That Requires Context
With total equity of ₩358.47 billion and a revaluation surplus of ₩920.2 billion embedded within PP&E, the equity base is more fragile than headline numbers suggest. The revaluation surplus is 2.6 times total equity — meaning that even a moderate mark-to-market reduction in the Dream Tower property's assessed value could cause equity to deteriorate rapidly. This is not an imminent risk in the current Jeju property environment, but it is a structural sensitivity that makes the 500%+ debt-to-equity ratio even less stable than it appears. Investors who use book equity as an anchor for valuation should weight this carefully.
Outlook
The Bull Thesis: Operating Leverage Meets Recovering Chinese Tourism
The Q1 2026 results confirm that the Dream Tower casino has crossed the operational inflection point. With fixed costs largely locked in and the cost base not meaningfully expandable without a new development phase, incremental casino revenue flows through to operating profit at a disproportionate rate. If the 40% casino revenue growth trajectory sustains through even two more quarters — a reasonable expectation given the continued expansion of Jeju direct flight capacity from China — annual operating profit could approach or exceed ₩50 billion in FY2026. At that level, the ₩109 billion annual interest burden would still suppress net income, but the gap would narrow to the point where full-year net profitability is achievable within the FY2026–FY2027 window.
The travel segment inventory build (₩10.99 billion in cruise and air ticket pre-purchases) suggests the non-casino business is also being positioned for a stronger Q2, which could provide a secondary revenue kicker and reduce concentration risk modestly. Meanwhile, the capital surplus reclassification signals that management's internal roadmap includes a post-normalisation dividend, which would represent a qualitative re-rating catalyst for a stock that has traded as a restructuring story for several years.
The Risk Case: Interest Burden, Leverage, and Single-Source Dependency
The bear case does not require a catastrophic scenario. Annual interest costs of approximately ₩109 billion are a structural drag that absorbs the entirety of operating profit at current run-rates and then some. Any meaningful slowdown in Chinese arrivals — whether from PRC travel policy changes, geopolitical friction, or a simple reversion of the direct-flight expansion — would compress casino revenue and, through the same operating leverage mechanism that has driven recent profit improvements, would amplify the downside into operating losses at a rapid pace.
The 500%+ debt-to-equity ratio leaves virtually no buffer against a deterioration in operating conditions. A rising interest rate environment would increase the cost of refinancing the existing debt stack. And the concentration of 76% of revenue in a single segment that is dependent on a single nationality of customers means that diversification benefits, which normally provide a counterweight in adverse scenarios, are effectively absent from this business model.
For investors, the near-term monitoring framework should focus narrowly on two data series: monthly Chinese visitor arrivals to Jeju (published by the Korea Tourism Organization) and the quarterly operating margin trajectory. If the operating margin continues its path toward 20% and above, the case for net profit normalisation becomes increasingly well-supported. If Chinese arrivals stall, the entire investment thesis requires reassessment.
This report is prepared for informational purposes based on regulatory filings disclosed on DART (Data Analysis, Retrieval and Transfer System) and does not constitute investment advice or a solicitation to buy or sell any security. All figures are derived from consolidated financial statements. Past performance and financial trends discussed herein are not indicative of future results. Investors should conduct their own due diligence and consult a licensed financial advisor before making any investment decisions.











