
SNT Dynamics (003570.KS) Q1 2026: Defense +54%, Exports Slip 7%
Domestic defense deliveries drive a record quarterly topline, but a widening FX loss and tax-rate windfall tell a more nuanced profit story.
Source: 64th Fiscal Year Q1 Quarterly Report (Jan 1 – Mar 31, 2026) — Filed May 12, 2026 with DART | Consolidated Financial Statements | Unit: ₩ billions

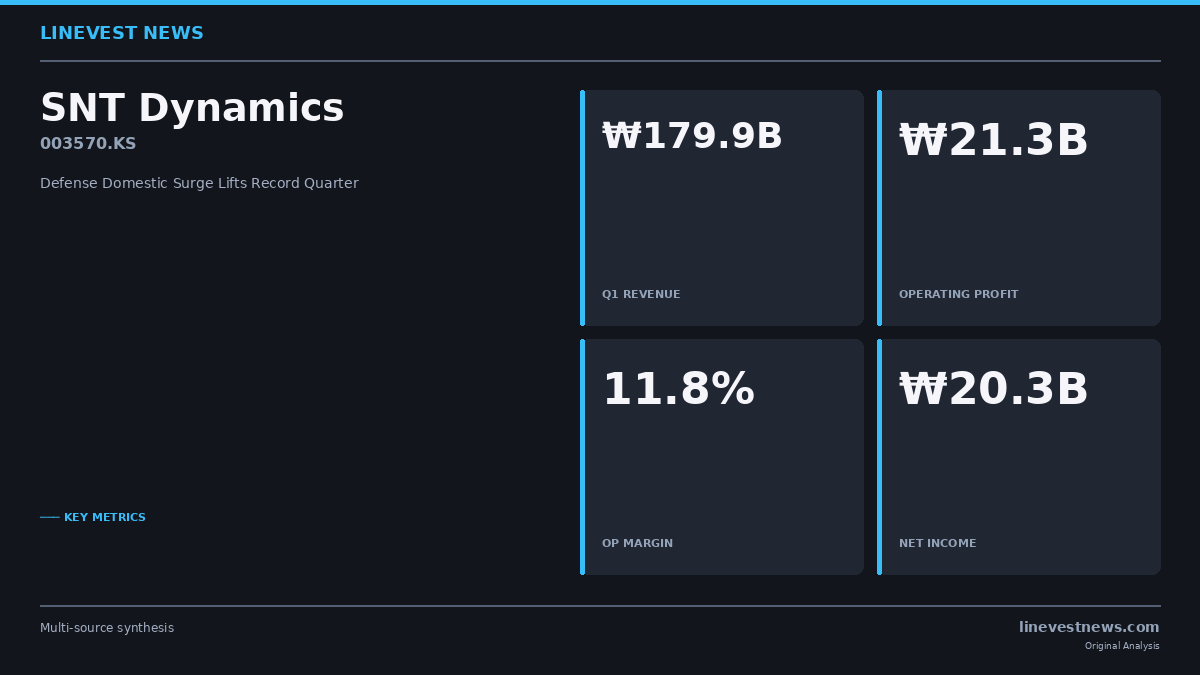
SNT Dynamics posted its highest-ever quarterly revenue in Q1 2026 at ₩179.9 billion, a 19.8% year-on-year gain powered almost entirely by a 53.9% surge in domestic defense deliveries to customers including the Defense Acquisition Program Administration, Hanwha Aerospace, and Korea Aerospace Industries. Operating profit rose 20.2% to ₩21.3 billion, holding the operating margin precisely at 11.8% — identical to Q1 2025 — as a 3.6% decline in SG&A offset a 1.1-point gross margin compression driven by the higher share of margin-thin domestic programs. That topline record must, however, be read against a multi-year context: FY2024's anomalously high 18.0% operating margin compressed sharply to 12.0% in FY2025 even as revenue grew, and Q1 2026's 11.8% represents a continuation of that normalized level rather than the start of a new upward trajectory. Beneath the headline, a 7.1-percentage-point drop in the effective tax rate from 22.3% to 15.2% inflated net income growth to 13.9%, masking what was a far more modest 4.5% expansion in pre-tax income — itself squeezed by foreign exchange losses that more than quadrupled year-on-year.
Balance Sheet
Asset Profile
| Item | Dec 2025 | Mar 2026 | Change |
|---|---|---|---|
| Cash and cash equivalents | 45.2 | 97.3 | +115.2% |
| Short-term financial instruments | 279.8 | 284.9 | +1.8% |
| Trade and other receivables | 189.2 | 173.9 | –8.1% |
| Inventories | 163.6 | 179.3 | +9.6% |
| Property, plant and equipment | 305.3 | 304.9 | –0.1% |
| Intangible assets | 16.3 | 17.7 | +8.6% |
| Long-term financial assets | 46.7 | 17.8 | –61.9% |
| Total assets | 1,228.6 | 1,252.6 | +2.0% |
Unit: ₩ billions
The defining characteristic of SNT Dynamics' balance sheet is extraordinary liquidity. Cash and cash equivalents combined with short-term financial instruments total ₩382.2 billion — nearly nine times the company's only interest-bearing liability, an exchangeable bond outstanding at ₩43.5 billion. Net cash (liquid financial assets minus interest-bearing debt) stands at approximately ₩338.7 billion, equal to 38% of total equity of ₩890.2 billion. Cash itself more than doubled within the quarter, from ₩45.2 billion to ₩97.3 billion, driven by the confluence of strong operating cash generation (discussed in the Cash Flow section) and the ₩33.5 billion monetization of equity securities held as long-term financial assets — the same disposal that reduced long-term financial assets by 61.9%.
PP&E was essentially flat at ₩304.9 billion as modest new equipment additions were absorbed by approximately ₩2.5 billion in depreciation. Intangible assets grew 8.6% to ₩17.7 billion, reflecting ongoing capitalization of development costs related to electrification programs and next-generation weapons systems. Inventories rose 9.6% to ₩179.3 billion, consistent with work-in-progress buildup ahead of anticipated domestic defense deliveries, while trade receivables fell 8.1% to ₩173.9 billion — indicating healthy collection of prior-period billings rather than any demand softening. The combination of declining receivables, rising inventories, and surging cash is a textbook early-stage production cycle response to a large order intake.
Debt Structure: Financial vs. Operating Liabilities
Total liabilities were essentially unchanged at ₩362.4 billion (+0.2%), but the internal composition shifted favorably. The sole financial liability — the exchangeable bond — declined 19.4% from ₩53.9 billion to ₩43.5 billion as bondholders exercised exchange rights into 257,575 treasury shares during the quarter. Meanwhile, trade and other payables expanded 23.4% from ₩87.1 billion to ₩107.5 billion, reflecting procurement volume ramp in support of higher domestic defense output. Declining interest-bearing leverage alongside rising interest-free operating liabilities is a structurally positive directional shift, and the debt-to-equity ratio ticked down marginally to 40.7% from 41.7%.
The exchangeable bond carries unusual mechanics that warrant attention. Issued July 14, 2025, maturing January 14, 2028, the ₩110.0 billion instrument carries a zero face coupon and a 1.0% yield-to-maturity via a redemption premium — meaning no periodic cash interest is paid, and the YTM accretes to the principal at maturity. Critically, exchange rights are exercisable into existing treasury shares rather than newly issued shares, which eliminates new-share dilution but gradually depletes the treasury share pool as conversions occur: treasury shares fell from 1,288,000 to 1,030,000 during the quarter as 257,575 shares were delivered. With ₩46.0 billion in maturities concentrated in the one-to-five-year bracket and net cash of ₩338.7 billion, repayment capacity is ample. The ongoing conversion activity is the more relevant variable to monitor, as it constrains the company's optionality to use treasury shares for future shareholder returns or employee incentive programs.
Capital Quality
Total equity expanded 2.7% from ₩866.8 billion to ₩890.2 billion. The composition is high quality by any measure: retained earnings of ₩810.6 billion (up from ₩785.2 billion) account for 91% of total equity, reflecting sustained multi-year profitability. Additional paid-in capital rose from ₩59.4 billion to ₩66.0 billion — the accounting entry recording the excess of fair value over par on exchangeable bond conversions. Other comprehensive income contracted sharply from ₩14.7 billion to ₩4.3 billion, entirely due to the reclassification of approximately ₩14.5 billion in cumulative FVOCI fair-value gains on disposed equity securities to retained earnings — a transfer within equity that is neutral to total equity. The treasury share offset in other equity components improved from (₩78.2 billion) to (₩76.2 billion) as conversion delivered treasury shares to bondholders.
Income Statement
Core Metrics (Q1 Year-on-Year Comparison)
| Item | Q1 2025 | Q1 2026 | Change |
|---|---|---|---|
| Revenue | 150.1 | 179.9 | +19.8% |
| Gross profit | 26.3 | 29.5 | +12.5% |
| Gross margin | 17.5% | 16.4% | –1.1pp |
| SG&A expenses | 8.6 | 8.2 | –3.6% |
| Operating profit | 17.7 | 21.3 | +20.2% |
| Operating margin | 11.8% | 11.8% | — |
| Net income | 17.8 | 20.3 | +13.9% |
| Net margin | 11.8% | 11.3% | –0.5pp |
Unit: ₩ billions. Basic EPS: ₩793 (Q1 2025) → ₩854 (Q1 2026), +7.7%.
The degree of operating leverage was effectively 1.0: a 19.8% revenue increase produced a near-identical 20.2% gain in operating profit. This is not leverage in the traditional amplification sense — it reflects near-perfect mechanical offsetting of two countervailing forces. Cost of sales grew 21.4% from ₩123.9 billion to ₩150.4 billion, outpacing revenue growth and compressing gross margin by 1.1 percentage points to 16.4%. The driver is product mix: the domestic defense programs that surged in Q1 carry structurally thinner margins than the automotive export components they displaced in revenue share. SG&A fell 3.6% from ₩8.6 billion to ₩8.2 billion against a double-digit revenue backdrop, demonstrating fixed-cost leverage at the administrative level. The two effects — gross margin compression of –1.1pp and SG&A leverage of +1.1pp — cancelled precisely to hold operating margin flat at 11.8%.
Below-the-line headwinds compressed pre-tax growth. Net financial income deteriorated from ₩5.2 billion to ₩2.6 billion between the two periods. Foreign exchange losses were the primary culprit, widening from ₩0.3 billion to ₩1.3 billion (+₩1.0 billion), reflecting the won's movement against the dollar and its impact on export-denominated revenue and receivables. Exchangeable bond interest — the accretion of the redemption premium under the zero-coupon structure — rose from a negligible ₩10 million to ₩0.4 billion, a secondary but growing drag. The combined effect compressed pre-tax income growth to just 4.5% (from ₩22.9 billion to ₩23.9 billion), sharply below the 20.2% operating profit growth rate.
The effective tax rate drop amplified headline profit. The tax charge fell from ₩5.1 billion to ₩3.6 billion, lowering the effective rate from 22.3% to 15.2%. This 7.1-point reduction lifted net income growth to 13.9% — more than three times the underlying pre-tax growth of 4.5%. The Q1 filing does not specify the source of the rate reduction, but probable contributors include R&D tax credits related to development expenditure and defense-related incentives under Korean tax law. On a recurring basis, the 13.9% net income growth substantially overstates the operational improvement, and investors assessing earnings trajectory should anchor to the 4.5% pre-tax figure. Basic EPS grew 7.7% to ₩854, lagging net income growth of 13.9% because the conversion of treasury shares through the exchangeable bond incrementally expanded the weighted-average diluted share count.
Annual Context: Profitability Has Already Normalized
| Item | FY2024 | FY2025 | Change |
|---|---|---|---|
| Revenue | 614.5 | 712.0 | +15.9% |
| Operating profit | 110.5 | 85.5 | –22.7% |
| Operating margin | 18.0% | 12.0% | –6.0pp |
| Net income | 96.1 | 61.6 | –36.0% |
Unit: ₩ billions
FY2024 produced an operating margin of 18.0% and a net margin of 15.6% — levels that appear anomalous relative to the company's longer-run profile and peer benchmarks. In FY2025, revenue grew 15.9% but operating profit contracted 22.7%, compressing the margin to 12.0% as cost escalation outpaced topline growth. Q1 2026's 11.8% operating margin is a continuation of that normalized band, not a recovery signal. The year-on-year operating profit growth in Q1 is arithmetically favorable in part because the comparison period (Q1 2025) had already absorbed the normalization from FY2024's exceptional levels.
R&D Intensity: A Rising Variable
R&D expenditure as a percentage of revenue reached 6.29% in Q1 2026, substantially above 3.51% for full-year FY2025 and 2.60% for FY2024, based on the footnote disclosures. This indicates a meaningful acceleration in investment directed at electric and hybrid drive units and next-generation weapons system programs. A portion of this R&D spending is capitalized as development costs under K-IFRS IAS 38, which contributed to the 8.6% expansion in intangible assets and deferred a corresponding portion of R&D expense from the current-period income statement. The net effect is a modest overstatement of reported operating profit relative to a full-expense treatment, though the magnitude — approximately ₩1.4 billion in intangible asset additions related to development — remains manageable in the context of ₩21.3 billion in reported operating profit.
Cash Flow
| Item | Q1 2025 | Q1 2026 | Change |
|---|---|---|---|
| Operating cash flow | (6.7) | 35.3 | +42.0 |
| Investing cash flow | (47.4) | 26.3 | +73.6 |
| Financing cash flow | (22.5) | (9.6) | +12.9 |
| Ending cash | 18.0 | 97.3 | — |
Unit: ₩ billions
The most consequential reversal in Q1 2026 is the operating cash flow swing from a ₩6.7 billion outflow in Q1 2025 to a ₩35.3 billion inflow. Underlying cash generated from operations — before working capital movements — improved from a small deficit to approximately ₩45.0 billion, reflecting both higher earnings and a ₩15.3 billion reduction in trade receivables from successful collection activity. The improvement confirms that the receivables decline on the balance sheet is driven by cash conversion, not demand weakness.
Free cash flow. Capital expenditure totaled ₩6.9 billion in the quarter — ₩4.3 billion in PP&E additions and ₩2.6 billion in intangible development spending. Deducting capex from operating cash flow yields free cash flow of approximately ₩28.4 billion, comfortably above net income of ₩20.3 billion. The earnings-to-cash quality ratio (operating CF / net income) of 1.74 is healthy. One important caveat: first-quarter cash flows carry seasonal distortions, and the prior-year comparison was negative, making single-quarter FCF a starting point rather than a definitive earnings quality verdict. Full-year validation will be necessary.
Management's characterization of capital intensity is notable. The company states that anticipated volume growth can be accommodated through equipment additions at existing facilities without new land acquisition — a low-capex-intensity operating model. The annualized capex guidance of approximately ₩20.0 billion, representing roughly 2.8% of FY2025 revenue, is consistent with this profile and leaves substantial operating cash flow available for financial returns or investment.
Investing cash flow turned to a ₩26.3 billion inflow from a ₩47.4 billion outflow in Q1 2025, primarily because short-term financial instrument gross settlements (maturities exceeding new purchases) combined with the ₩33.5 billion equity security disposal. Financing outflows narrowed from ₩22.5 billion to ₩9.6 billion as dividends paid fell 57.8% from ₩22.4 billion to ₩9.5 billion — the primary driver of the financing improvement and a meaningful signal about the company's current capital return posture.
Key Findings
Domestic defense concentration is both the growth engine and the primary risk. Revenue growth in Q1 2026 was essentially a single-source event: domestic defense deliveries surged 53.9% to ₩102.8 billion while export revenue — primarily automotive drivetrain components to global OEMs including Daimler Truck — contracted 7.4% to ₩77.1 billion. The export share of revenue fell from 55.5% in Q1 2025 to 42.9% in Q1 2026. SNT Dynamics operates as a near-mono-segment business, with transportation equipment (defense and automotive combined) at 99.5% of revenue and industrial machinery at 0.5%. Within that dominant segment, domestic defense has now become the clear sole engine of growth. If domestic procurement timing slips or defense budget allocation shifts, the automotive export channel — itself in contraction — provides a diminished buffer.
Backlog opacity is a structural limitation on forward visibility. Defense companies are conventionally valued on order backlog as the primary forward indicator. SNT Dynamics explicitly states that it does not manage or disclose backlog figures due to the classified nature of its defense contracts. This is not unusual among Korean defense subcontractors, but it means the 53.9% domestic surge cannot be extrapolated forward with any rigor — investors must rely on quarterly revenue prints as the sole real-time proxy for order fulfillment health. The current utilization rate of 71.5% against an annualized production capacity of approximately ₩1.09 trillion confirms adequate headroom for incremental volume without expansion capex, but provides no signal on whether the demand pipeline sustains at current levels.
Net income growth substantially overstates underlying earnings improvement. Decomposing the 13.9% net income gain: operating profit grew 20.2% on favorable volume leverage; that gain was more than offset at the pre-tax level by ₩1.0 billion in additional foreign exchange losses and ₩0.4 billion in exchangeable bond interest accretion, compressing pre-tax growth to 4.5%; and net income then recovered to 13.9% solely because the effective tax rate fell 7.1 percentage points. None of the tax rate improvement is attributable to improved operations. Recurring earnings power in Q1 2026 is better approximated by the 4.5% pre-tax growth rate, and even that modest figure reflects a less favorable financial income environment than Q1 2025.
₩338.7 billion in net cash remains without a visible deployment thesis. The balance sheet carries net liquid assets equal to 38% of equity — a scale of capital that represents both substantial optionality and a valuation drag if capital efficiency is the investor's lens. Q1 signals are consistent with accumulation rather than deployment: the company simultaneously monetized ₩33.5 billion in equity investments, reduced dividends 58% year-on-year, and maintained minimal capex at ₩6.9 billion for the quarter. The intended use of the accumulating cash — whether R&D acceleration in electrification and defense modernization, M&A activity, or eventual enhanced shareholder return — is not visible in current disclosures. The annualized R&D intensity jump from 3.51% in FY2025 to 6.29% in Q1 2026 is the clearest current signal that some portion of cash is being directed toward future product development, but ₩11.3 billion in quarterly R&D spending accounts for only a fraction of the net cash pool.
Exchangeable bond conversions are systematically reducing the treasury share buffer. In Q1 alone, 257,575 treasury shares were delivered against bond conversions, reducing the treasury share count from 1,288,000 to 1,030,000. At the current quarterly pace, the remaining treasury pool would be exhausted within approximately four quarters even if no new conversions accelerated. Once the treasury share pool is depleted, any remaining exchangeable bond balance would need to be settled in cash or restructured. Given the ₩43.5 billion outstanding balance and ₩338.7 billion in net cash, settlement capacity is not a concern — but the gradual drainage of the treasury share inventory limits the company's future flexibility to use buybacks or stock-based compensation from that pool.
Outlook
The bull thesis rests on sustained domestic defense volumes and balance sheet optionality. The Korean defense procurement environment, under ongoing multi-year modernization programs, continues to favor domestic subcontractors with established production relationships and certified platforms. SNT Dynamics' position as a drivetrain and powertrain supplier for armored vehicles and aircraft positions it to capture incremental volumes as procurement timelines advance. A 71.5% utilization rate against a ₩1.09 trillion annualized capacity means substantial volume absorption is possible without expansion capex, implying near-marginal-cost economics on incremental domestic programs. The balance sheet is fortress-grade: ₩338.7 billion net cash, 40.7% debt-to-equity, zero financial stress risk, and a quarterly FCF yield of ₩28.4 billion. Accelerating R&D investment (6.29% of Q1 revenue) in electrification and next-generation defense programs suggests management is investing in the product roadmap required to defend platform positions through the next decade of technology transitions in both the defense and commercial vehicle segments.
The bear thesis centers on margin normalization, earnings quality, and channel concentration. The operating margin reset from 18.0% in FY2024 to the 11–12% range is complete and has shown no recovery signal despite the revenue reacceleration — Q1 2026 holds flat rather than recovering. Export revenue, which historically carried superior margins to domestic defense programs, is contracting at 7.4% year-on-year, and its declining share of the revenue mix creates additional structural headwind for blended gross margins. The effective tax rate benefit that inflated Q1 net income is unlikely to recur at the same 7.1-point magnitude in subsequent quarters, implying headline net income growth should decelerate materially even if operations are stable. Foreign exchange loss risk is not trivial: with 43% of revenue still export-derived, won/dollar movements directly affect reported profit below the operating line, and FX losses more than quadrupled year-on-year in Q1. Finally, the absence of backlog disclosure creates a fundamental constraint on forward conviction — there is no reliable mechanism to distinguish between a structural rerating of domestic procurement volumes and a timing-driven quarterly concentration.
The capital allocation decision is the central unresolved variable. The simultaneous reduction in dividends, monetization of equity investments, and minimal capex spending suggests a company building cash ahead of a significant allocation decision, or one that has not yet determined where to deploy accumulated capital most productively. The outcome — whether the ₩338.7 billion net cash is directed toward aggressive R&D and inorganic growth to re-rate the business, or returned to shareholders through buybacks and special distributions — will likely determine whether the current valuation reflects the operating business alone or begins to price in a differentiated capital efficiency story. The Q2 2026 report and any interim management communications on capital priorities will be the primary monitoring signals.
This report is prepared for informational purposes only, based on SNT Dynamics' 64th Fiscal Year Q1 2026 Quarterly Report (January 1 – March 31, 2026), publicly filed with DART on May 12, 2026, and written on July 20, 2026. Nothing herein constitutes investment advice or a solicitation to buy or sell any security. SNT Dynamics is not affiliated with LineVest News, which is an independent publication and not a registered investment adviser. All figures are drawn from consolidated financial statements as disclosed; readers should conduct their own due diligence before making any investment decision.











