
Loading market data...
Tuesday, July 21, 2026
Back to HomeNewsAll Orion Holdings coverage

Orion Holdings (001800.KS) Q1 2026: Revenue Hits ₩1T as Showbox Swings ₩21.7B Profit

By MinJeKim0 views
Share
Orion Holdings (001800.KS) Q1 2026: Revenue Hits ₩1T as Showbox Swings ₩21.7B Profit

Orion Holdings (001800.KS) Q1 2026: Revenue Hits ₩1T as Showbox Swings ₩21.7B Profit

A record-breaking quarter powered by an unusual double engine — confectionery stability and a single blockbuster film — but raw material inflation and minority interest leakage cloud the earnings quality.

Source: Quarterly Business Report — Filed April 2026 with DART | Consolidated Financial Statements | Unit: ₩ billions



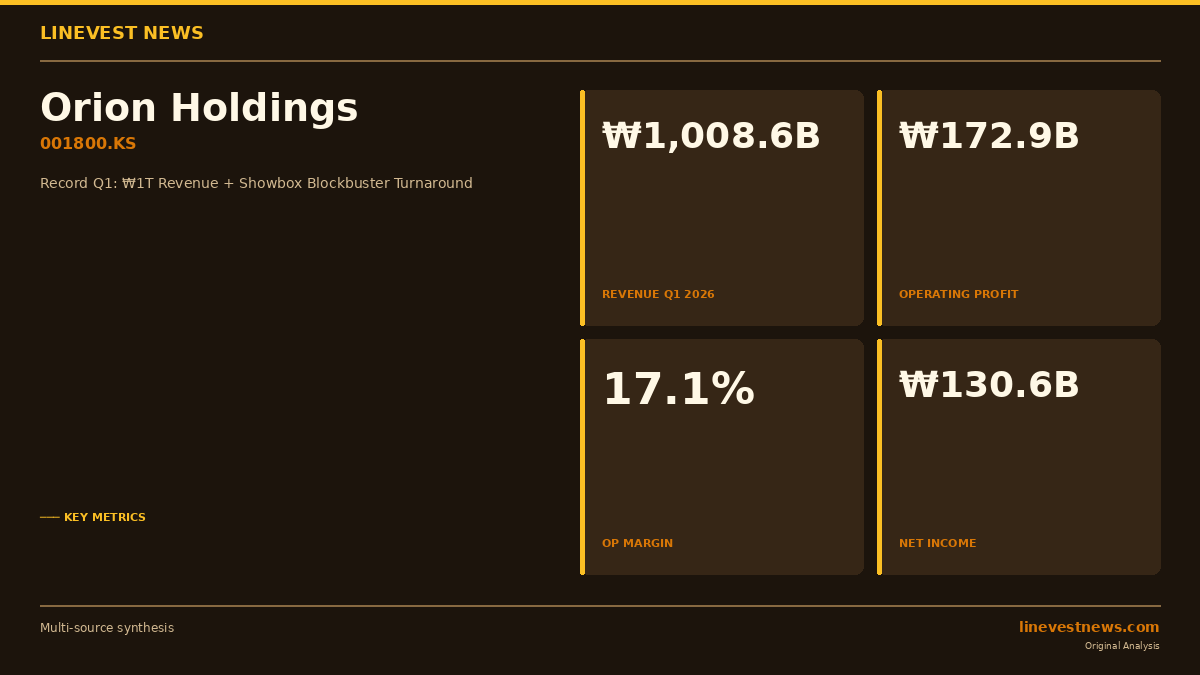
Orion Holdings posted consolidated revenue of ₩1,008.6 billion and operating profit of ₩172.9 billion in Q1 2026, representing an operating margin of 17.1% — the strongest quarterly result in the company's history by both absolute profit and margin. According to the company's investor relations disclosure, revenue and operating profit surged 24.1% and 48.5% year-on-year, respectively, against the same period in 2025. The headline driver beyond the core confectionery franchise was subsidiary Showbox, which swung from a full-year 2025 operating loss of ₩11.7 billion to a single-quarter operating profit of ₩21.7 billion, riding the extraordinary commercial success of The King and the Jester — the 34th film in Korean box office history to surpass 10 million admissions. Against this, a 35% surge in imported vegetable oil prices to ₩6,148 per kilogram introduces a credible margin headwind that investors cannot dismiss heading into the second half.


Balance Sheet

Asset Composition and Liquidity Depth

ItemFY2025 End (Dec)Q1 2026 End (Mar)Change
Cash & cash equivalents₩353.4B₩358.1B+1.3%
Short-term financial deposits₩986.1B₩1,119.7B+13.6%
Trade receivables₩184.9B₩223.1B+20.7%
Inventories₩324.2B₩308.9B−4.7%
Property, plant & equipment₩2,102.5B₩2,215.1B+5.4%
Intangible assets (ex. goodwill)₩217.3B₩211.8B−2.5%

The most consequential balance sheet development in Q1 was not cash itself but the surge in short-term financial deposits — from ₩986.1 billion to ₩1,119.7 billion, a ₩133.6 billion increase driven in part by a Sell-Buy foreign currency deposit trust (USD 40 million). Combining cash and deposits, the group held ₩1,477.8 billion in near-liquid assets at quarter-end, equivalent to 22.8% of total assets. This is not idle cash sitting unproductively; it is a deliberate treasury management posture that reflects the holding company's role as a capital aggregator above its operating subsidiaries.

Trade receivables expanding 20.7% to ₩223.1 billion is the natural counterpart to a quarter of sharply elevated revenue, and in isolation is a healthy indicator of genuine top-line volume rather than channel stuffing. Inventory declining 4.7% to ₩308.9 billion in the same period corroborates this reading: product moved through to customers rather than accumulating on shelves. Together, these two line items tell a coherent story of real demand pull.

The ₩112.6 billion increase in PP&E deserves close reading. Within that figure, assets under construction expanded from ₩129.7 billion to ₩206.2 billion — a ₩76.5 billion jump — indicating that meaningful new capacity investment is underway but has not yet been commissioned. Until these projects transition to depreciable fixed assets, the associated capital commitment will not appear in the depreciation line, making the current cost structure temporarily flattering relative to the investment cycle's eventual run-rate.

Liability Structure — Financial vs. Operating

Total liabilities rose from ₩1,027.5 billion to ₩1,222.5 billion, a 19.0% increase in a single quarter. The expansion was concentrated almost entirely in current liabilities, which grew from ₩707.5 billion to ₩890.0 billion (+25.8%). The non-current trade payables balance is negligible at roughly ₩70 million, confirming that virtually none of the liability growth represents long-term financial debt. Instead, the increase reflects the natural working capital mechanics of a strong revenue quarter — higher trade payables, accrued dividends payable, and short-term borrowings that are operationally ordinary in nature.

A ₩3.0 billion mark-to-market loss on the USD trust derivative contract was recorded, but the scale is immaterial against total assets of ₩6.47 trillion. The group's debt-to-equity ratio sits at approximately 23.3%, placing Orion Holdings comfortably in the top tier of financial stability among Korean mid-to-large cap holding companies. Net cash is strongly positive at the consolidated level — a structural attribute, not a cyclical accident.

Capital Quality and the Minority Interest Problem

Paid-in capital (capital stock ₩31.3 billion + share premium ₩1,251.4 billion = ₩1,282.7 billion) and retained earnings-related reserves (legal and voluntary reserves ₩573.4 billion + unappropriated retained earnings ₩364.2 billion = ₩937.6 billion) present a balanced capital structure. The 12.5% decline in unappropriated retained earnings from ₩416.1 billion to ₩364.2 billion reflects dividend payments and the transfer of ₩37.3 billion into appropriated reserves — a routine appropriation cycle, not a distress signal.

The more structurally significant observation is the divergence between controlling interest equity growth (+1.1%) and non-controlling interest equity growth (+2.5%, from ₩2,692.4 billion to ₩2,759.8 billion). Non-controlling interests — representing external shareholders in operating subsidiaries, primarily Orion Corporation — grew more than twice as fast as the parent's own equity base. This is the defining structural tension of the holding company model: when operating subsidiaries outperform, the economic benefits are partially captured by minority shareholders of those subsidiaries before they ever reach the consolidated parent's attributable earnings. It is a leakage mechanism embedded in the corporate architecture, not a one-quarter anomaly.


Income Statement

Core Profitability Metrics

MetricFY2025 Full YearQ1 2026vs. Quarterly Avg (÷4)*
Revenue₩3,393.1B₩1,008.6B+18.9%
Operating profit₩487.7B₩172.9B+41.8%
Operating margin14.4%17.1%+2.7pp
Net profit₩337.8B₩130.6B+54.6%
Net margin10.0%13.0%+3.0pp

The quarterly average comparison understates actual year-on-year growth because Q1 is seasonally the strongest quarter due to Lunar New Year and Chinese Spring Festival timing. The company's IR-disclosed year-on-year comparisons against Q1 2025 show revenue +24.1% and operating profit +48.5%, which are the more operationally meaningful figures.

Segment Breakdown — Where the Profit Actually Came From

Segment-level disclosure reveals a highly concentrated revenue base. The confectionery segment contributed ₩929.3 billion in external revenue (92.1% of the total), while the filmed entertainment segment contributed ₩78.9 billion (7.8%). At the operating profit level, the reported segment figures are: confectionery ₩165.3 billion, filmed entertainment ₩21.7 billion, holding company ₩58.4 billion, and other segments −₩2.5 billion, summing to a segment aggregate of ₩242.8 billion. Consolidation adjustments of −₩70.0 billion then bring the consolidated operating profit to ₩172.9 billion.

The holding company segment's ₩58.4 billion operating profit on ₩61.4 billion of revenue — an apparent 95% margin — demands specific qualification. Of that ₩61.4 billion in holding company revenue, ₩60.9 billion derives from intra-group royalties and dividends received from subsidiaries. These are eliminated at the consolidation stage. Treating the holding company segment profit as additive to consolidated operating profit would be a fundamental error in reading the financial statements. The consolidation adjustment line is precisely the mechanism that prevents this double-counting.

The Showbox Inflection Point

The filmed entertainment reversal warrants separate treatment. Showbox recorded an operating loss of ₩11.7 billion for the full year 2025. In a single quarter — Q1 2026 — it generated ₩21.7 billion in operating profit, a swing of ₩33.4 billion. The catalyst was The King and the Jester, which became the 34th Korean film to cross 10 million admissions and ranked first in domestic box office revenue and second in total admissions for films released in Korea per the company's disclosure. A concurrent title, If We, drew 2.47 million admissions. Combined, these two releases gave Showbox a 57.1% share of the total Korean theatrical market and a 75.9% share of the Korean film sub-segment in Q1 2026, according to the Korean Film Council's Q1 2026 industry settlement report published on April 29, 2026.

The leverage characteristics of theatrical distribution are extreme: above a breakeven threshold, nearly every incremental ticket sale flows directly to profit. This explains how Showbox went from full-year loss to a ₩21.7 billion quarterly profit — the cost base did not scale proportionally with the revenue surge, producing the kind of operating leverage that confectionery's more linear cost structure cannot replicate.

Cost Structure — Raw Material Pressure Building

The confectionery cost structure divides cleanly into a relatively stable fixed-cost layer and a highly volatile variable-cost layer. Fixed costs — primarily depreciation (₩37.9 billion at the Orion Corporation subsidiary level) and R&D personnel — did not change materially quarter-to-quarter. The variable-cost exposure, however, has become the dominant financial risk.

Imported vegetable oil, a core confectionery ingredient, has experienced a 106% price increase over two years: from ₩2,981 per kilogram in 2024 to ₩4,550 in 2025 to ₩6,148 in Q1 2026. Imported cocoa derivatives rose from ₩12,151 to ₩14,857 per kilogram over the same period. These are not temporary commodity spikes that can be hedged away — they reflect structural shifts in global agricultural commodity markets.

The pass-through constraint is severe. The domestic retail price of Pocachip — Orion's flagship potato chip product — was ₩14,606 per kilogram in Q1 2026, slightly below the ₩14,716 recorded for full-year 2025. Domestic selling prices are effectively flat to slightly declining even as input costs surge. The inability to raise prices in the face of private-label competition and consumer price sensitivity means that margin protection must come from volume leverage and operational efficiency rather than pricing.

That the operating margin expanded to 17.1% despite this cost pressure is attributable to two forces operating simultaneously: the confectionery segment's manufacturing leverage as factory utilization rates rose (with the Russian facility running at 117.02% of nameplate capacity, well beyond design output), and Showbox's theatrical margin operating on an almost entirely different cost curve. Strip out Showbox's ₩21.7 billion contribution, and the underlying confectionery margin story looks considerably more contested.


Cash Flow

Summary Cash Flow

ItemQ1 2026
Operating cash flow₩200.3B
Capital expenditure (PP&E acquisitions)₩86.6B
Free cash flow (FCF)~₩113.7B
Cash + short-term deposits (end of period)₩1,477.8B

Operating cash flow of ₩200.3 billion against operating profit of ₩172.9 billion indicates a working capital and non-cash adjustment profile that is mildly favorable — depreciation adds back to cash, and while trade receivables expanded, the inventory drawdown partially offset the working capital drag. The overall operating cash conversion is healthy for a quarter with this revenue profile.

Capital expenditure of ₩86.6 billion is consistent with the balance sheet observation of construction-in-progress expansion. This level of capex in a single quarter, if sustained, implies a full-year capex run-rate of roughly ₩346 billion — materially higher than the implied maintenance capex level for the existing asset base. The investments under construction are likely capacity additions across the overseas manufacturing network (Vietnam, Russia) based on the disclosed utilization data, though specific project disclosures are not itemized in the quarterly filing.

Free cash flow of approximately ₩113.7 billion after capex is comfortably positive, and the ₩138.3 billion expansion of the combined cash-and-deposits pool to ₩1,477.8 billion confirms that the business is generating liquidity faster than it is deploying it through investment and dividends. The derivative loss (USD trust mark-to-market) and tax payments are embedded in the operating cash flow figure per Korean GAAP classification conventions.


Key Findings

China Recovery Is Lagging — And the Geographic Center of Gravity Is Shifting

The Orion Corporation subsidiary's China factory utilization data tells a story of highly uneven recovery. The Shenyang facility is running at only 28.35% of capacity, Guangzhou at 57.2%. Shanghai (79.7%) and Langfang (85.8%) are operating more normally, but the drag from Shenyang in particular — historically a key volume facility — means that China's contribution to consolidated profit remains well below what the asset base would support at full utilization.

What prevents this from being a more serious crisis is the strength of non-China geographies. Russia's Orion International Euro is running at 117.02% of nameplate capacity, a physical impossibility on a sustained basis that signals both demand strength and the prioritization of this market. Choco Pie's Russian retail price has risen to the won equivalent of ₩16,291 per 12-pack in Q1 2026, a 43% increase from ₩11,394 in 2024 — evidence of genuine pricing power in the CIS market that contrasts sharply with the domestic Korean situation. Vietnam's factory utilization has also strengthened. The effective center of gravity for Orion's international growth is migrating away from China toward Russia and Southeast Asia, and the capital allocation decisions that follow from this shift will shape medium-term earnings trajectory.

Showbox's Structural Earnings Volatility

The Q1 profitability boost from Showbox is genuine and the scale of market share achieved (57.1% of total box office) is remarkable. But the architecture of that performance rests almost entirely on a single film. Theatrical distribution revenue is episodic by nature — films are released on a discrete schedule, reception is unpredictable, and the absence of a major hit in any given quarter can swing the segment from substantial profit to loss within a single reporting period, as 2025's full-year operating loss of ₩11.7 billion demonstrates.

The announced 2026 pipeline includes Gunche (directed by Yeon Sang-ho, starring Jeon Ji-hyeon), Salmokji (starring Kim Hye-yoon), and Pokseol (starring Kim Yoon-seok). These are credible commercial projects attached to proven talent. However, even experienced industry observers cannot reliably predict box office outcomes, and the contribution from this segment to H2 2026 consolidated earnings remains a significant binary variable. Analysts modeling Orion Holdings' full-year 2026 earnings need to stress-test this line explicitly rather than annualizing the Q1 run rate.

Raw Material Inflation — The Slow-Moving Margin Compressor

The vegetable oil price doubling over two years is not a transient procurement problem. At ₩6,148 per kilogram versus ₩2,981 just two years ago, the input cost inflation embedded in Orion's confectionery cost of goods sold is structurally permanent unless prices retreat — an outcome that cannot be assumed. The combination of constrained domestic pricing power (Pocachip retail prices flat to down year-on-year), rising input costs, and the inability to fully pass through inflation in markets sensitive to private-label alternatives sets up a slow-motion margin compression scenario for the confectionery segment.

The Q1 2026 result masked this pressure because manufacturing leverage (higher volumes, especially from Russia at 117% utilization) and Showbox's high-margin entertainment revenue offset raw material cost drag at the consolidated level. If either of those offsets weakens — Russia utilization normalizes, Showbox releases underperform — the input cost inflation will have greater visibility in reported margins.

New Business Diversification — Optionality Without Near-Term Earnings Impact

Three diversification initiatives were disclosed: a joint venture with Suhyup (the National Federation of Fisheries Cooperatives) for seaweed and seafood processing products (established September 2025), a gum disease treatment investment through Haisens Bio, and a biotech joint venture with Shandong Lukang. None of these is likely to be material to consolidated earnings within a two-year horizon. They represent optionality — insurance against the confectionery cycle and the Showbox volatility — but should not be given earnings credit until revenue disclosures confirm meaningful scale.

Holding Company Architecture and the EPS Ceiling

The non-controlling interest expansion outpacing controlling interest equity growth is a structural feature, not an accident. Because Orion Holdings is a holding company with publicly listed operating subsidiaries (Orion Corporation being the dominant one), a significant portion of subsidiary earnings must be allocated to external shareholders of those subsidiaries before they reach Orion Holdings' attributable net profit. In a strong earnings quarter, this leakage is amplified. It sets a ceiling on how rapidly controlling shareholder EPS can compound, even in an environment of strong subsidiary performance. This is not a reason to avoid the stock, but it is a reason why price-to-earnings multiples at the holding company level may structurally discount the apparent consolidated earnings power.


Outlook

Orion Holdings enters Q2 2026 from a position of unusual financial strength — ₩1.48 trillion in near-liquid assets, a 23% debt-to-equity ratio, and demonstrated capacity to generate ₩200+ billion of operating cash flow in a single quarter. The Q1 2026 result represents what the business looks like when multiple positive factors align simultaneously: confectionery volume leverage from strong seasonal demand, Russian market outperformance, and a blockbuster film title in the entertainment segment.

The bull thesis for the remainder of 2026 rests on three pillars: continued Russian and Vietnamese confectionery volume growth sustaining manufacturing leverage; at least one major Showbox theatrical success from the announced H2 lineup; and gradual recovery in the Shenyang and Guangzhou factories reducing the China utilization drag. If these materialize, a full-year 2026 operating profit in the range of ₩580–600 billion — approximately 19–23% above 2025 — is achievable without requiring heroic assumptions.

The risk scenario is equally concrete. If vegetable oil and cocoa prices remain at current levels through 2026, and if Showbox's H2 releases fail to approach the commercial scale of The King and the Jester, the consolidated operating margin would likely compress back toward the 14–15% range seen in full-year 2025. Sustained Chinese factory underutilization at Shenyang is a drag that the asset write-up risk has not yet fully reflected in the balance sheet. And the minority interest leakage means that even in a favorable scenario, the improvement in controlling shareholder attributable earnings per share will be less dramatic than the headline operating profit growth suggests.

Simple annualization of Q1 2026 operating profit (₩172.9 billion × 4 = ₩691.6 billion) is mechanically misleading. Q1 is structurally the strongest quarter in Orion's annual calendar due to Lunar New Year and Spring Festival consumption peaks, combined with the non-repeating benefit of Showbox's highest-ever market share quarter. A balanced full-year estimate should apply meaningful seasonal discounts to Q2–Q4 on both the confectionery and entertainment lines.

The holding company discount to net asset value — a persistent feature of Korean conglomerate structures — means the investment case ultimately depends not only on subsidiary earnings growth but on whether Orion Holdings can narrow that discount through capital returns or structural simplification. The current dividend policy and treasury posture do not appear oriented toward that outcome in the near term.


This report is prepared for informational purposes based on filings disclosed on DART and does not constitute investment advice or a solicitation to buy or sell any security. LineVest News and its analysts may hold positions in securities mentioned. Past performance of any company discussed is not indicative of future results. Readers should conduct their own due diligence before making any investment decisions.

NewsFinanceMarkets

Go deeper than the headline

You just read what happened. Here's how to read what it means.

Free daily briefing

The Korean market, every morning — free

LineVest Daily lands in your inbox before every Seoul open: the key KOSPI & KOSDAQ stories, earnings, disclosures and foreign flows — in plain English. Free, no card required.

Get LineVest Daily — free →
This company

Full report on Orion Holdings

We read Orion Holdings's latest DART filing in full — financials under K-IFRS, governance, and what it means for the stock. PDF in your inbox within 3 hours.

$12 · one-time

Get the Orion Holdings report
Every name you watch

Follow the whole market

Reading several Korean stocks a week? Read every analysis article the moment it publishes — full daily KOSPI & KOSDAQ coverage plus the 90-day archive.

$9.99 · monthly

Subscribe

Independent journalism based on primary DART filings — not investment advice. No brokerage affiliation.







