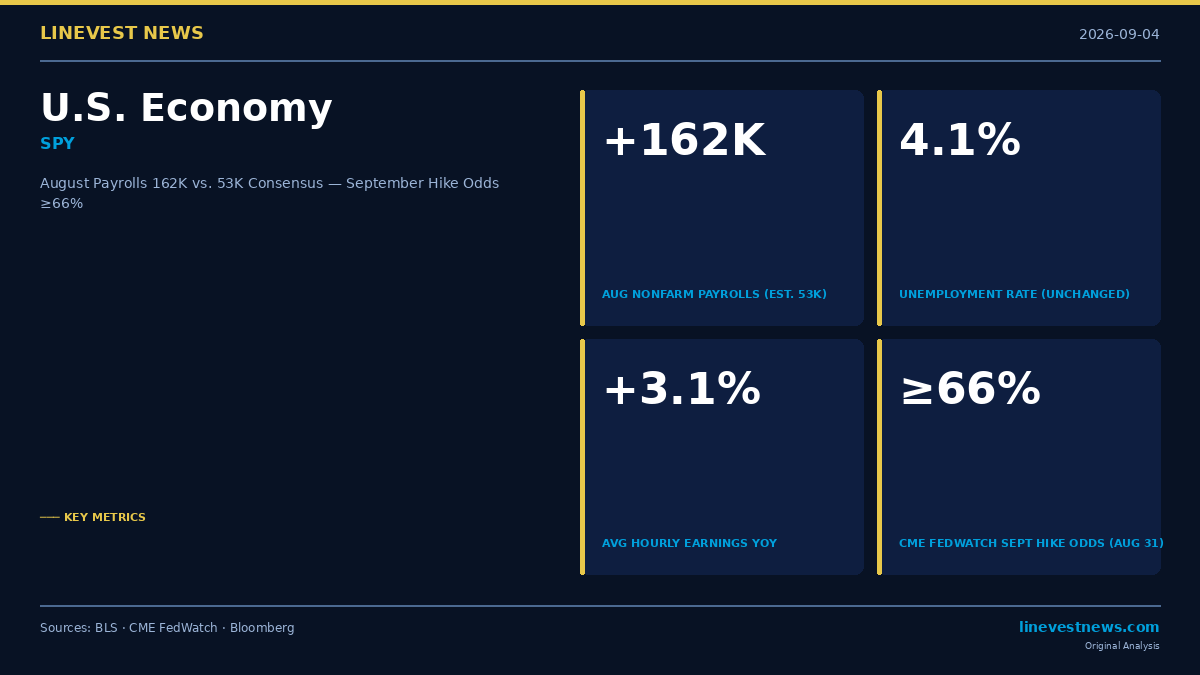
TL;DR - August nonfarm payrolls: +162,000 — more than three times the 53,000 consensus estimate - Unemployment rate unchanged at 4.1%; average hourly earnings +0.3% MoM, +3.1% YoY - Prior-month revisions: net +55,000 upward (July from −23K to +21K, +44K; June up +11K to a final +31K) - CME FedWatch September hike probability: ~66% (August 31 figure, per Forbes/CME; September 4 post-jobs reading not separately published at time of writing); 2-year Treasury yield rose to 4.39%, highest since January 2025 - September 11 headline CPI (BLS scheduled) is the last major data point before the September 16 decision; the Fed blackout period began September 5, meaning no further Fed statements — only the CPI data itself remains
Part A: What the Data Showed
The Bureau of Labor Statistics released the August 2026 Employment Situation Summary on September 4. The headline number — 162,000 new nonfarm payroll jobs — landed more than three times the 53,000 Dow Jones consensus, and more than five times the prior 12-month monthly average of 31,000 (per BLS).
Key Metrics at a Glance
| Metric | August 2026 | July 2026 (revised) |
|---|---|---|
| Nonfarm Payrolls | +162,000 | +21,000 (was −23,000) |
| Unemployment Rate | 4.1% | 4.1% |
| Average Hourly Earnings (MoM) | +0.3% | +0.3% |
| Average Hourly Earnings (YoY) | +3.1% (per BLS) | +3.3% |
| Average Weekly Hours | 34.4 | 34.3 |
| Labor Force Participation Rate | 61.6% | ~61.5% |
Selected Sector Gains and Losses
| Sector | August Change |
|---|---|
| Leisure & Hospitality (incl. Food Services) | +59,000 |
| Local Government Education | +42,000 |
| Construction | +22,000 |
| Manufacturing | +16,000 |
| Information | −23,000 |
| Other sectors (BLS-calculated residual) | +46,000 |
| Total Nonfarm (BLS headline) | +162,000 |
The information sector decline included computing infrastructure and data processing (−8,000), publishing industries (−7,000), broadcasting and content providers (−5,000), and other information sub-sectors.
Prior-Month Revisions
July's initial read of −23,000 was revised up by 44,000 to +21,000 (preliminary revision; the September BLS release will carry another round of revisions). June was revised up by 11,000 to a final +31,000. The net +55,000 combined revision confirms the labor market was stronger through the summer than initially reported.
Part B: Investment Implications for the September 16 FOMC Decision
Immediate Market Reaction (September 4, 2026)
Markets fell modestly as the blowout print landed against a backdrop of already-elevated rate hike expectations (66% on August 31):
| Asset | Move |
|---|---|
| S&P 500 | −0.3% |
| Nasdaq Composite | −0.3% |
| Dow Jones | −0.5% |
| 2-Year Treasury Yield | +5.3 bps → 4.39% (highest since January 2025) |
| 10-Year Treasury Yield | +1.8 bps → 4.76% |
| U.S. Dollar Index (DXY) | Above 99 |
| Gold | Down to ~$4,484/oz |
The 2-year yield, which rose 5.3 bps to hit its highest level since January 2025, is the market's most direct indicator of near-term rate expectations.
Rate Hike Probability Trajectory
| Date | Event | CME FedWatch September Hike Odds |
|---|---|---|
| Before Aug 28 | Pre-Warsh keynote | ~30–35% |
| Aug 28 | Warsh Jackson Hole speech | ~50% (CNBC: "coin flip") |
| Aug 31 | — | 66% (Forbes / CME data) |
| Sept 4 | August Jobs Report | ≥66% (reinforced Aug 31 level; exact post-data CME reading unavailable) |
At the July FOMC meeting, the committee voted 9–3 to hold, with three regional Fed presidents — Hammack (Cleveland), Kashkari (Minneapolis), and Logan (Dallas) — dissenting in favor of an immediate 25-basis-point hike. Following Fed Chair Kevin Warsh's hawkish Jackson Hole keynote ("work to do" on inflation), broader committee sentiment has shifted toward hike consideration ahead of September 15–16.
RSM Chief Economist Joe Brusuelas summarized the near-term setup: "Looks like the Fed is likely to hike rates at its September meeting unless the August CPI surprises to the downside."
Three Scenarios for September 16
With the current fed funds rate at 3.50–3.75% and July's headline CPI at 3.4% year-over-year (per BLS, released August 12, 2026), the September 16 decision hinges on the headline CPI report for August, due September 11. Note: the Fed's official 2% inflation objective is stated in terms of PCE, not CPI — CPI is used here as an available leading indicator of the same broad price trend.
Scenario A — Hike Very Likely: August headline CPI prints at or above 3.5% (re-acceleration from July's 3.4%). Inflation remains well above the Fed's 2% PCE objective, and a robust labor market removes demand-side justification for a hold. Hike odds would be expected to rise above 80%. Banks may benefit as floating-rate loan yields reprice ahead of deposit costs; REITs, utilities, and long-duration bonds face pressure.
Scenario B — Hike Probable: August headline CPI comes in at 3.0%–3.4% — roughly in line with or modestly below July's level. A strong labor market alongside elevated inflation gives the committee's hawkish wing sufficient justification to act. Hike odds remain elevated, with the committee likely to hike but with less urgency. The 2-year yield consolidates near the September 4 close. Equities remain under modest pressure.
Scenario C — Hike Much Less Likely: August headline CPI decelerates materially — below 3.0% — a significant shift from July's 3.4%. Under this outcome, the FOMC's nine-vote hold bloc from July would find it more difficult to reverse course against a backdrop of job gains concentrated in leisure/hospitality and seasonal government education hiring and declining information employment. Hike odds fall meaningfully; equities may stage a relief rally.
What Investors Should Watch Between Now and September 16
September 11 — August Headline CPI (per BLS 2026 release schedule): The decisive data point. At or above 3.5% maps to Scenario A; 3.0%–3.4% maps to Scenario B; below 3.0% maps to Scenario C. This is a BLS statistical release — it is unaffected by the Fed's blackout period.
Fed Blackout (Already Active): The quiet period began Saturday, September 5 — no Fed official statements until after the September 16 decision. All positioning must rely on available data.
2-Year Treasury Yield: The real-time rate-path signal. Watch the September 4 close of 4.39% as the reference level — a sustained move above 4.45% reflects escalating hike odds; a decline toward 4.20% signals mounting doubt.
Financials (XLF) vs. Utilities (XLU): A rising ratio tends to reflect rate-hike positioning. Banks may benefit when short-term loan rates reprice faster than deposit costs; utilities, as long-duration income proxies, tend to trade inversely with rate expectations.
Dollar Index (DXY) Above 99: A stronger dollar pressures commodity exporters and U.S. multinationals with significant overseas revenue — relevant for S&P 500 companies that derive 40%+ of sales abroad.
This article is journalism, not investment advice. LineVest News is not a registered investment adviser. Past Fed decisions are not predictive of future policy actions. Rate hike probability figures reflect market-implied odds at the dates shown in the trajectory table (through September 4, 2026) and will change with incoming data.
Sources
- BLS Employment Situation Summary — August 2026
- BLS Consumer Price Index Summary — July 2026
- UPI: Nonfarm payrolls grew by 162,000 in August
- Yahoo Finance: August Jobs Report Live Updates
- CNBC: July 2026 CPI inflation report — annual rate 3.4%
- Forbes: CME FedWatch Provides A 66% Chance Fed Will Hike Rates In September
- CNBC: September Fed Decision Is Now a Coin Flip as Rate Hike Odds Increase Post-Warsh
- Kiplinger: Blowout August 2026 Jobs Report Raises September Rate Hike Odds