FADU (440110.KQ) Q1 2026: Revenue Triples to ₩59.5B, First Profit
After two fiscal years of annual operating losses ranging from ₩65.5 billion to ₩95.1 billion, FADU's Gen5 data center SSD controller ramp finally converts sustained R&D investment into the company's first meaningful quarterly operating profit — while single-customer concentration above 50% and an unresolved criminal indictment shadow the recovery narrative.
Source: Q1 2026 Quarterly Report (12th Fiscal Year, First Quarter) — Filed May 12, 2026 with DART | Consolidated Financial Statements | Unit: ₩ billions
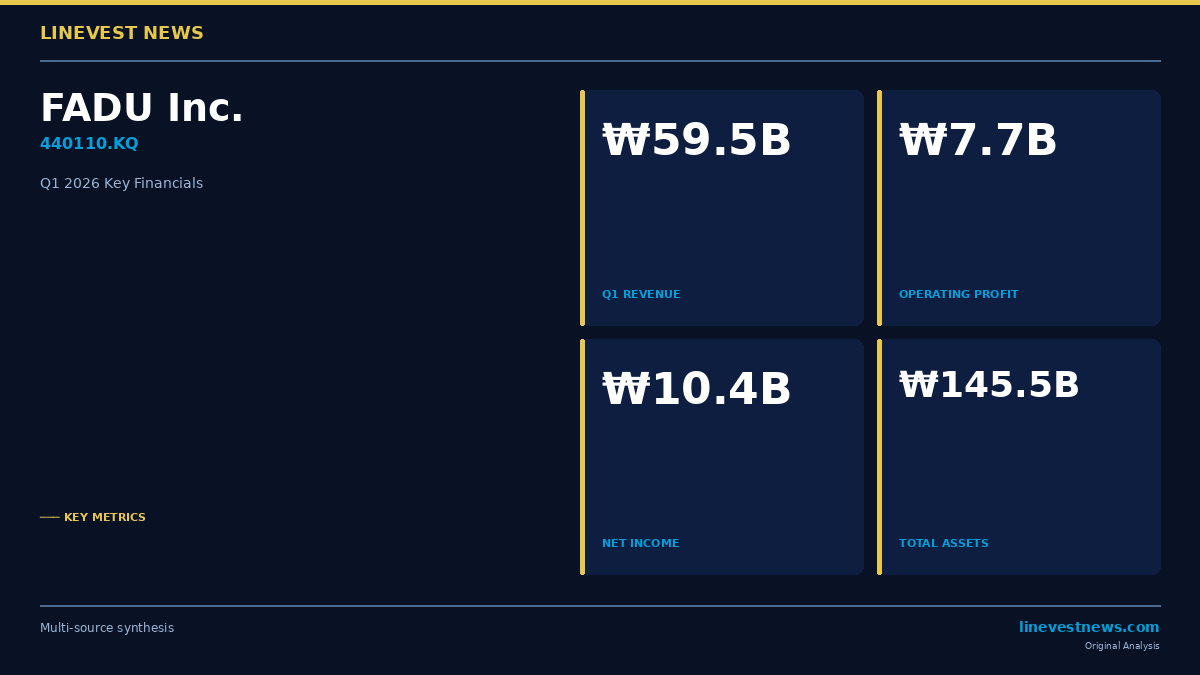
FADU posted its first significant quarterly operating profit since its KOSDAQ listing, with Q1 2026 consolidated revenue reaching ₩59.5 billion — more than triple the ₩19.2 billion delivered in Q1 2025 — while the prior-year operating loss of ₩12.0 billion reversed to an operating profit of ₩7.7 billion. Annual losses that peaked at ₩95.1 billion in FY2024 were the cost of maintaining R&D expenditure above 70% of revenue throughout the Gen4 and Gen5 SSD controller development cycle; the Q1 2026 result indicates that the ramp-up of Gen5 controllers for hyperscale data centers has now tipped that fixed-cost base into positive territory. Whether a single quarter of profitability driven in majority by one unnamed customer constitutes a durable inflection, however, is a distinct question from the operating mechanics — and one that runs alongside a criminal indictment of the chief executive and active securities class action litigation that proceed on their own independent timetable.
Balance Sheet
Asset Composition
| Item | End-FY2025 (Dec 2025) | End-Q1 2026 (Mar 2026) | Change |
|---|---|---|---|
| Cash and cash equivalents | 40.8 | 43.7 | +7.1% |
| Trade receivables | 5.7 | 20.8 | +263.2% |
| Inventory | 41.2 | 46.4 | +12.7% |
| Property, plant and equipment | 13.6 | 13.5 | −0.3% |
| Intangible assets | 1.2 | 1.2 | −6.7% |
| Total assets | 122.4 | 145.5 | +18.9% |
Unit: ₩ billions
Total assets expanded by ₩23.1 billion over the quarter, with roughly 65% of that increase concentrated in trade receivables (up ₩15.1 billion) and the remainder largely in inventory (up ₩5.2 billion). The 3.6-fold surge in receivables — from ₩5.7 billion to ₩20.8 billion — is a mechanical consequence of revenue tripling within a single quarter, but the pace merits attention: the ₩15.1 billion receivables increase represents 37% of the ₩40.3 billion incremental revenue, indicating that cash conversion from the ramp-up is meaningfully lagging behind the growth rate. The collection cycle is examined in detail in the cash flow section.
Inventory at ₩46.4 billion reflects the NAND-and-DRAM-heavy raw material requirements of SSD module production, where NAND alone typically accounts for 80–90% of finished-goods cost. The intangible asset balance of just ₩1.2 billion is structurally significant: FADU expenses virtually its entire annual R&D outlay as a period cost rather than capitalizing development expenditures onto the balance sheet. This accounting conservatism eliminates the latitude to inflate operating profit through capitalization adjustments, lending greater credibility to the reported ₩7.7 billion operating profit than would otherwise be the case for a company in an early ramp phase.
The accumulated deficit narrowed from ₩217.1 billion at end-FY2025 to ₩206.7 billion at March 31, 2026 — a reduction of exactly ₩10.4 billion, matching net income attributable to controlling shareholders for the quarter to the unit. The overall equity structure remains anchored by the ₩239.1 billion capital surplus raised at IPO, which has been absorbing cumulative losses since listing. Total equity of ₩34.1 billion is, in substance, the residual of those IPO proceeds after two and a half years of operating expenditure in excess of revenue.
Liability Structure — Financial vs. Operating
| Category | Item | Q1 2026 (₩ billions) |
|---|---|---|
| Financial liabilities | Short-term borrowings | 11.5 |
| Convertible bonds | 4.3 | |
| FVTPL financial liabilities | 18.6 | |
| Lease liabilities (current + non-current) | 4.5 | |
| Operating liabilities | Trade payables | 10.9 |
| Contract liabilities (current + non-current) | 46.9 |
Total liabilities grew from ₩102.6 billion to ₩111.4 billion over the quarter. The most notable movement is in contract liabilities — a proxy for advance payments and deferred revenue — where the current portion alone surged from ₩13.9 billion to ₩36.4 billion, pulling total other current liabilities from ₩14.4 billion to ₩38.8 billion. Expanding contract liabilities in a ramp phase are typically read as a forward-revenue signal: customers prepaying against confirmed future orders. The ₩18.6 billion in FVTPL (fair value through profit or loss) financial liabilities represents derivative-embedded instruments carried at market value, introducing mark-to-market income statement volatility and constituting a meaningful exposure relative to total equity of ₩34.1 billion. Right-of-use assets of ₩4.2 billion and the corresponding lease obligations reflect IFRS 16 commitments of manageable scale.
Capital Structure Quality
The debt-to-equity ratio improved from 518.5% at end-FY2025 to 326.8% at end-Q1 2026. The reduction reflects both the quarter's profit and the dilutive effect of stock option exercises — which added ₩0.06 billion to paid-in capital, ₩4.1 billion to capital surplus, and ₩2.9 billion in financing cash inflows. A ratio of 326.8% remains elevated in absolute terms, and given that a significant portion of liabilities carries financial rather than operating character, the balance sheet's capacity to absorb renewed operating losses without breaching covenants or forcing capital raises is limited. Sustained profitability over the next two to three quarters would be required to meaningfully de-risk the capital structure.
Income Statement
Core Revenue Metrics
| Item | FY2024 | FY2025 | Q1 2026 (3 months) |
|---|---|---|---|
| Revenue | 43.5 | 92.4 | 59.5 |
| Operating profit (loss) | (95.1) | (65.5) | 7.7 |
| Operating margin | — | — | 12.9% |
| Net profit (loss) | (91.5) | (76.2) | 10.2 |
| Net margin | — | — | 17.2% |
Unit: ₩ billions
The three-year trajectory is the story itself. In FY2024, FADU spent more than twice its own revenue on operations, booking an operating loss of ₩95.1 billion against ₩43.5 billion in sales — losses that exceeded revenue by a factor of 2.2x. FY2025 brought revenue to ₩92.4 billion, more than double the prior year, but still generated an operating loss of ₩65.5 billion. Then Q1 2026 arrived: a single quarter's revenue of ₩59.5 billion reached 64% of the prior full fiscal year, and the company swung to a ₩7.7 billion operating profit. Against Q1 2025 — when revenue was ₩19.2 billion and the operating loss was ₩12.0 billion — the year-on-year improvement amounts to ₩19.7 billion in operating earnings.
The Operating Leverage Mechanism
The mechanics of the inflection are transparent. Gross profit came in at ₩34.7 billion on revenue of ₩59.5 billion, implying a gross margin of 58.2%. Against that high-margin structure, selling, general and administrative and R&D expenses — which are predominantly fixed in nature, anchored by engineering headcount and tool depreciation — rose only 21.8% year-on-year, from ₩22.1 billion in Q1 2025 to ₩27.0 billion in Q1 2026. With revenue up 209.8%, the spread between incremental revenue and incremental fixed cost widened dramatically, producing the operating leverage that converted gross profit into a positive operating line for the first time.
Net margin of 17.2% runs above operating margin of 12.9%, owing to ₩3.2 billion in financial income during the quarter — compared with ₩0.5 billion in Q1 2025. The step-up in financial income is non-operational and unlikely to recur at this magnitude; recurring earnings power is better assessed at the operating profit level.
R&D Intensity — The Fixed Cost That Explains Everything
| Item | FY2024 | FY2025 | Q1 2026 |
|---|---|---|---|
| R&D expenditure (₩ billions) | 66.1 | 68.7 | 14.6 |
| Revenue (₩ billions) | 43.5 | 92.4 | 59.5 |
| R&D / Revenue | 151.9% | 74.4% | 24.6% |
A single variable explains both the depth of FADU's prior losses and the magnitude of the current recovery: R&D intensity. In FY2024, the company spent 152% of its revenue on research and development — the economics of a fabless chipmaker investing in future product generations before commercial validation. FY2025 brought the ratio to 74%, still too high for operating profitability at that revenue scale. In Q1 2026, R&D expenditure of ₩14.6 billion (annualized approximately ₩58.6 billion) dropped to 24.6% of revenue — not because the absolute R&D budget was materially cut, but because revenue scaled rapidly enough to normalize the ratio. The level at which this ratio ultimately stabilizes will define the ceiling of sustainable operating margins for as long as Gen6 and subsequent generations remain in active development.
Cash Flow
| Item | Q1 2025 | Q1 2026 | Change |
|---|---|---|---|
| Operating cash flow | (13.5) | 0.9 | +14.4 |
| Investing cash flow | 9.8 | (1.0) | −10.8 |
| Financing cash flow | (0.7) | 2.0 | +2.7 |
| Ending cash balance | 28.0 | 43.7 | — |
Unit: ₩ billions
Operating cash flow turning positive — from −₩13.5 billion in Q1 2025 to +₩0.9 billion in Q1 2026 — is a meaningful directional signal. Earnings quality, however, tells a considerably more cautious story. The ratio of operating cash flow to net income stands at 0.9 ÷ 10.2 = 0.08, one of the lowest levels consistent with genuine profitability rather than accounting artifacts. Of the ₩10.2 billion in net income, the vast majority was absorbed by working capital expansion: trade receivables consumed ₩15.1 billion and inventory accumulated a further ₩5.2 billion, with the net working capital change totaling −₩11.4 billion. This pattern — profit on the income statement while cash remains trapped in receivables and stock — is characteristic of companies in the early stages of a revenue ramp-up and does not invalidate the underlying profitability. It does, however, mean that FADU's cash generation will remain constrained until customer payment cycles normalize against the new revenue run rate. The next quarter's receivables collection data is the single most consequential variable for assessing whether the profit is real in a cash sense.
Free cash flow — operating cash flow of ₩0.9 billion minus capital expenditure of ₩1.3 billion — remains modestly negative at −₩0.4 billion. The sharp swing in investing cash flows between periods is largely a base-effect artifact: Q1 2025 included ₩11.8 billion in proceeds from the redemption of short-term financial instruments, creating an unusually favorable comparative base. Financing cash flow turned to a net inflow of ₩2.0 billion, driven by ₩2.9 billion of stock option exercise proceeds more than offsetting ₩0.9 billion in lease repayments. Cash at quarter-end stands at ₩43.7 billion — sufficient to meet near-term obligations at the current rate of cash consumption, with no immediate liquidity pressure.
Key Findings
Customer Concentration at the Apex
A single customer — identified in the filing as Customer 1 — accounted for 51.5% of Q1 2026 revenue, or ₩30.7 billion of the ₩59.5 billion total. The trajectory of this exposure is striking in its consistency: 33.0% in FY2024, rising to 60.5% in FY2025, and 51.5% in Q1 2026. Structural concentration above 50% at one counterparty means that inventory adjustments, order deferrals, or product qualification changes at a single buyer translate immediately into material revenue volatility for FADU. Any assessment of whether Q1 2026's profitability is reproducible must begin with a view on this customer's purchase cadence over the following two to three quarters — it is the load-bearing assumption in every forward scenario.
Product Mix Shift Sustaining Margin Quality
The share of SSD controller revenue within total revenue has risen in an unbroken trend: 55.0% in FY2024, 69.4% in FY2025, and 80.4% in Q1 2026. Controllers, as IP-intensive semiconductor solutions, carry substantially higher margins than complete SSD module sales, where NAND flash alone typically represents 80–90% of unit cost. The combination of mix improvement toward higher-margin controllers and the revenue volume needed to absorb fixed R&D costs together explain how gross margin reached 58.2% in Q1 2026. The product roadmap sustains this logic: the Gen5 controller operating at 14 GB/s is currently in commercial ramp, while Gen6 development at 28.5 GB/s targeting next-generation AI infrastructure workloads is already on the roadmap — extending the data center product cycle and the underlying demand driver.
EEUM: Early-Stage CXL Optionality
79.91%-owned subsidiary EEUM Inc. is developing CXL (Compute Express Link) switch technology, targeting the memory pooling and expansion requirements of AI server architectures. The segment is firmly in investment mode — EEUM posted a net loss of approximately ₩0.96 billion in Q1 2026 — and its drag on consolidated results is modest in absolute terms but negative. CXL represents a structural growth option for FADU beyond the SSD controller addressable market, but the timeline to commercial revenue from this subsidiary remains undefined, and current results reflect pre-revenue investment spending.
Legal Exposure: The Overhang the Income Statement Cannot Resolve
The quarterly report's notes disclose two categories of legal proceedings constituting material unresolved risk. Multiple securities-related class action lawsuits have been filed at Seoul Central District Court, represented by Hannuri Law, with individual claim amounts including ₩0.1 billion and ₩0.67 billion among those cited. More significantly, the company and its representative director were indicted by the Seoul Southern District Prosecutors' Office on December 18, 2025, on charges of violating the Capital Markets Act.
These proceedings trace directly to the circumstances of FADU's KOSDAQ listing in August 2023, which ascribed an implied enterprise value of approximately ₩1.5 trillion to the company. The IPO prospectus contained revenue projections for FY2024 of approximately ₩371.5 billion; actual FY2024 revenue came in at ₩43.5 billion — a shortfall of 88%. The company states in its notes that the financial impact of ongoing proceedings "cannot be predicted at present." Regardless of how the operating recovery develops, this judicial risk advances on its own independent timeline. Potential outcomes — indemnification obligations, fines, and reputational costs — are entirely separate from and not mitigated by the current improvement in operating metrics.
Industry Positioning
Semiconductors are cyclical, but enterprise SSD controllers for data centers sit within a structurally growing segment driven by AI workload proliferation and cloud infrastructure scaling. FADU's fabless structure concentrates the cost base in R&D and sales rather than capital expenditure, which creates substantial operating leverage once revenue reaches sufficient scale — as Q1 2026 has now demonstrated in practice. The company is, however, only entering what may be its first profitable year after two full fiscal years of losses that exceeded revenue; a single quarter's result is more appropriately read as the beginning of a J-curve recovery than as evidence of normalized, repeatable earnings power.
Outlook
The Bull Case
The Q1 2026 result validates the core thesis: sustained R&D investment in Gen5 SSD controller technology has produced the revenue scale needed to generate positive operating leverage. At 58.2% gross margin and with R&D intensity declining toward a level — currently 24.6% of revenue — compatible with meaningful profitability, the model has structural capacity to produce double-digit operating margins at higher revenue. Contract liabilities expanding from ₩13.9 billion to ₩36.4 billion during the quarter provide forward revenue visibility and signal that confirmed demand is ahead of current delivery rates. The Gen6 roadmap, if it achieves comparable commercial traction, extends the growth opportunity into the next AI infrastructure capex cycle. Annualizing Q1 2026 results produces approximately ₩238 billion in revenue and ₩30.7 billion in operating profit — figures that would represent a genuine transformation of the company's financial profile relative to where it stood twelve months ago.
The Risk Case
Several structural constraints constrain that scenario. Customer concentration above 50% at a single counterparty is the most immediate near-term risk — a purchase deferral or specification change from Customer 1 could eliminate Q1 2026's profitability within a single reporting period. Earnings quality remains thin at an operating-cash-to-net-income ratio of 0.08, meaning profit is currently accumulating on paper while cash remains tied up in receivables; until collection cycles normalize, free cash flow will stay negative. The debt-to-equity ratio of 326.8%, while improved from 518.5%, leaves limited financial buffer against an operational setback, particularly given the proportion of liabilities carrying financial rather than operating character. And overarching all operating considerations, the criminal indictment and class action exposure represent a ceiling on stakeholder credibility that no income statement improvement can directly address.
Whether the Gen5 ramp constitutes a durable J-curve recovery or a concentrated-customer cyclical spike will likely be resolved by Q2 and Q3 2026 results — particularly the trajectory of trade receivables collection, the stability of order flow from Customer 1, and any material developments in the legal proceedings. Until both the customer diversification question and the judicial overhang are substantially resolved, treating the Q1 2026 profit as confirmed normalized earnings would be premature.
This report is prepared for informational purposes based on FADU Inc.'s Q1 2026 Quarterly Report (12th Fiscal Year, First Quarter) filed May 12, 2026 with DART. It does not constitute investment advice or a solicitation to buy or sell any securities. LineVest News is an independent publication and holds no position in any company mentioned. Source: DART Quarterly Report (prepared July 27, 2026).