
Loading market data...
Tuesday, July 21, 2026
Back to HomeNewsAll Daewoong Pharmaceutical coverage

Daewoong Pharmaceutical (069620.KS) Q1 2026: Revenue +6% but Operating Profit Collapses 42.6% as CapEx Surge Drains Cash

By MinJeKim0 views
Share
Daewoong Pharmaceutical (069620.KS) Q1 2026: Revenue +6% but Operating Profit Collapses 42.6% as CapEx Surge Drains Cash

SLUG: daewoong-pharmaceutical-069620-q1-2026-operating-profit-collapses-capex-surge

META: Daewoong Pharma Q1 2026: Revenue hits ₩377.8B (+6% YoY) but operating profit crashes 42.6% to ₩22.2B; net income misleads at +29% on one-time gain.


Source: Q1 2026 Quarterly Report (분기보고서) — Filed Q2 2026 with DART | Consolidated Financial Statements | Unit: ₩ billions



Daewoong Pharmaceutical (069620.KS) Q1 2026: Revenue +6% but Operating Profit Collapses 42.6% as CapEx Surge Drains Cash

Revenue growth masks a profound earnings quality divergence — operating profit cratered while a ₩22.1 billion one-time asset disposal gain inflated headline net income, making Q1 2026 one of the most analytically misleading quarters in recent Daewoong history.

Source: Q1 2026 Quarterly Report (분기보고서) — Filed Q2 2026 with DART | Consolidated Financial Statements | Unit: ₩ billions


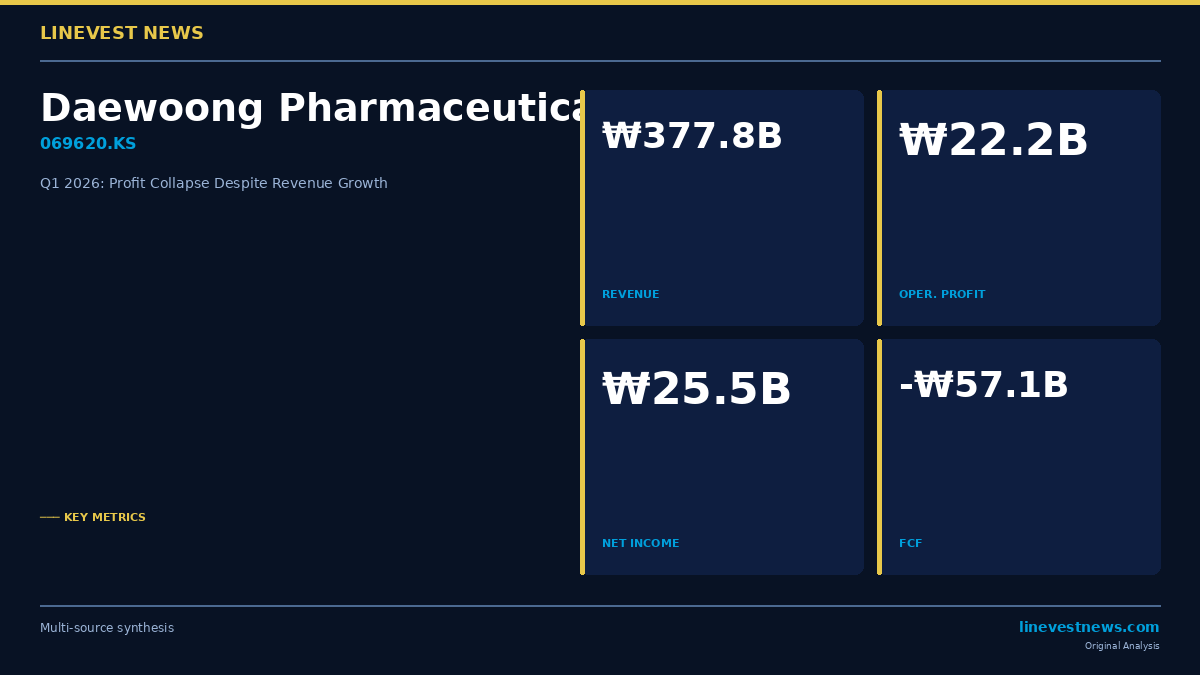
Daewoong Pharmaceutical posted consolidated revenue of ₩377.8 billion (USD 271.8 million) in Q1 2026, a 6.0% year-on-year increase, yet its operating profit collapsed 42.6% to ₩22.2 billion (USD 16.0 million), compressing the operating margin from 10.9% to just 5.9% — the sharpest single-quarter margin contraction the company has reported in the current business cycle. The deterioration was structural: cost of goods sold surged 13.4%, more than double the revenue growth rate, while selling, general and administrative expenses expanded 10.1% and R&D spending widened 6.5%, leaving gross profit at ₩181.2 billion (USD 130.4 million), slightly below the prior year's ₩183.1 billion. Headline net income of ₩25.5 billion (USD 18.3 million), up 29.0% year-on-year, flatters the operating picture entirely — ₩22.1 billion of that figure derived from a disposal gain on financial assets held at fair value through profit or loss, a non-recurring item that carries zero forward earnings power. Beneath the surface, Daewoong is navigating the most capital-intensive phase of its multi-year infrastructure buildout, with the Navota Plant No. 3 and the Makok C&D Center both targeting H1 2026 completion, and the financial fingerprints of that cycle — negative free cash flow of ₩57.1 billion and short-term borrowings up 148.9% — are impossible to ignore.


Part A: Disclosure Summary

Balance Sheet

Asset Base Expansion Driven by Construction-in-Progress

Total consolidated assets rose 3.7% from ₩2,362.8 billion (USD 1,700.6 million) at end-FY2025 to ₩2,450.4 billion (USD 1,763.2 million) as of March 31, 2026. The movement was dominated by the continued build-up of fixed asset infrastructure rather than working capital accumulation.

ItemFY2025 End (₩B)Q1 2026 End (₩B)ChangeNote
Cash & Cash Equivalents₩168.9₩163.7-3.1%CapEx drawdown
Trade & Other Receivables₩219.5₩222.5+1.4%Stable vs. revenue growth
Inventories₩310.9₩315.0+1.3%Navota export pre-stocking
Property, Plant & Equipment₩825.3₩884.3+7.1%Plant investment recognized
Intangible Assets₩367.5₩384.5+4.6%Ongoing R&D capitalization

The most significant balance sheet signal is the growth in construction-in-progress assets from ₩290.6 billion to ₩313.6 billion — a ₩23.0 billion (USD 16.6 million) sequential increase in a single quarter. This line item directly reflects the two anchor projects: the Makok C&D Center, with a total project cost of ₩163.7 billion (USD 117.8 million) targeting July 2026 completion, and Navota Plant No. 3, budgeted at ₩101.4 billion (USD 73.0 million) targeting June 2026 completion. Once both assets are transferred to PP&E, they will begin generating depreciation charges in H2 2026 — adding a new layer of fixed cost that will further test margin recovery even as revenue potentially accelerates.

Receivables growth of just 1.4% against revenue growth of 6.0% is a constructive signal, suggesting collections are running efficiently and there is no meaningful build-up in channel credit. Inventory expansion of 1.3% is modest and appears consistent with preparation for Navota overseas shipments, particularly to the Middle East and China markets where distribution agreements are being deepened.

Liability Structure: Short-Term Borrowings Signal Bridge Financing

Liability CategoryFY2025 End (₩B)Q1 2026 End (₩B)Change
Short-Term Borrowings₩70.8₩176.2+148.9%
Current Portion of Long-Term Debt₩80.0₩80.0flat
Current Bonds Payable₩91.0₩91.0flat
Long-Term Borrowings₩307.3₩307.3flat
Non-Current Bonds Payable₩243.5₩243.5flat
Total Financial Debt₩827.3₩898.0+8.5%
Trade & Other Payables₩249.4₩253.7+1.7%

The 148.9% surge in short-term borrowings — from ₩70.8 billion to ₩176.2 billion (USD 126.8 million) — is the single most pointed liability-side development of the quarter. The composition of the remaining financial debt was essentially unchanged across maturities, indicating management deliberately chose short-duration bridge financing rather than extending the long-term debt stack. This is consistent with the expectation that once the two construction projects reach completion and begin generating operating cash flows, near-term refinancing risk should normalize. However, the weighted average cost of short-term credit has risen materially in the current rate environment, and the incremental interest burden will register in upcoming quarters.

Operating liabilities — trade payables and other operating payables — grew by only 1.7%, closely tracking revenue, which confirms that the pressure points are entirely on the capital structure side rather than reflecting deterioration in supplier payment behavior.

The net debt-to-equity ratio (순차입금/총자본) widened from 36.72% to 38.88%, marking the high-water mark of the current capex cycle leverage. With an A+ Stable domestic credit rating maintained, Daewoong retains meaningful access to capital markets, but the direction of leverage is unambiguously upward until the investment cycle closes.

Capital Quality

Shareholders' equity stood at ₩1,179.6 billion (USD 848.6 million) as of March 31, 2026. Paid-in capital totals ₩179.4 billion (share capital ₩29.0 billion plus additional paid-in capital ₩150.4 billion), against which retained earnings of ₩852.5 billion represent a 4.75x multiple — a strong indicator of endogenous capital accumulation built over years of profitable operations. Retained earnings grew by ₩18.9 billion sequentially even after absorbing ₩6.9 billion in dividend payments, confirming that the company continues to generate positive net equity accretion. The quality of equity is not in question; what is in question is whether operating profitability will recover quickly enough to offset the fixed-cost layering from new assets entering service.


Income Statement

Revenue Growth Masks Deteriorating Unit Economics

MetricQ1 2025 (₩B)Q1 2026 (₩B)Change
Revenue₩356.5₩377.8+6.0%
Gross Profit₩183.1₩181.2-1.0%
Gross Margin51.4%48.0%-3.4%pt
Operating Profit₩38.7₩22.2-42.6%
Operating Margin10.9%5.9%-5.0%pt
Net Income₩19.8₩25.5+29.0%
Net Margin5.6%6.7%+1.1%pt

The gross profit line is the most important diagnostic indicator this quarter. Despite a ₩21.3 billion top-line increase, gross profit declined by ₩1.9 billion — meaning every incremental unit of revenue generated in Q1 2026 came at a margin structure worse than the prior year. Cost of goods sold reached ₩196.6 billion (USD 141.4 million), a 13.4% increase against revenue growth of 6.0%. The gross margin compression of 3.4 percentage points to 48.0% reflects two converging pressures: logistics and packaging cost increases associated with Navota export volume growth, and input cost inflation on key active pharmaceutical ingredients including Erdosteine (+5.3%) and Metformin (+7.3%).

Fixed Cost Expansion Reinforces the Margin Squeeze

SG&A expenses of ₩159.0 billion (USD 114.4 million) grew 10.1% year-on-year, again outpacing the 6.0% revenue growth. Within SG&A, recurring R&D expenditure reached ₩45.0 billion (USD 32.4 million), up 6.5%, maintaining the R&D-to-revenue ratio at approximately 15.9%. This level of R&D intensity reflects the continuing investment in three major clinical-stage assets: Bersiporocin for idiopathic pulmonary fibrosis (Phase 2, FDA Orphan Drug and Fast Track designations secured), DWP213388 for autoimmune disease (Phase 1), and a portfolio of near-term regulatory submissions including DWJ1573 for diabetes and Plodicitinib for canine atopic dermatitis.

The operating cost structure dynamic in Q1 2026 is a textbook example of negative operating leverage — revenue grew 6.0% while the combined cost base (COGS + SG&A) grew at a rate significantly exceeding that, compressing the operating profit line by nearly half. This is not a demand-side problem; Navota and Fexuclue continue to gain international traction. Rather, it is a deliberate choice to invest ahead of anticipated revenue growth, with the expectation that the fixed cost base is being built for a larger business rather than the current revenue run rate.

The Net Income Distortion

Net income of ₩25.5 billion (USD 18.3 million), up 29.0% year-on-year, is arithmetically correct but analytically misleading for any investor focused on business quality. The ₩22.1 billion disposal gain on financial assets measured at fair value through profit or loss — almost certainly a partial monetization of a strategic equity position — accounts for virtually the entire net income improvement. Stripping this out, underlying net income from core operations would have been only marginally positive relative to the prior year after accounting for the higher interest expense associated with the short-term borrowing surge. Investors using the headline net income figure to construct trailing earnings multiples or to assess earnings momentum will arrive at a materially inflated picture of operating capability.


Cash Flow

Operating Cash Flow Improves, But CapEx Overwhelms

ItemQ1 2025 (₩B)Q1 2026 (₩B)Change (₩B)
Operating Cash Flow₩3.1₩17.2+₩14.1
Investing Cash Flow-₩22.0-₩91.0-₩69.0
Financing Cash Flow₩13.8₩65.8+₩52.0
Closing Cash Balance₩97.8₩163.7+₩65.9

Operating cash flow of ₩17.2 billion (USD 12.4 million) represents a meaningful improvement from ₩3.1 billion in the prior year, driven by better working capital management despite the reported operating profit decline. The divergence between operating profit (₩22.2 billion) and operating cash flow (₩17.2 billion) is relatively contained, suggesting that non-cash charges such as depreciation and amortization are acting as partial offsets to the earnings shortfall.

CapEx and Free Cash Flow

Capital expenditure totaled ₩74.3 billion (USD 53.5 million) — ₩74.3 billion on property, plant and equipment plus ₩20.5 billion on intangible assets, bringing total gross investing outflows to ₩91.0 billion. The PP&E component alone represents a 3.7x surge versus the prior year period, entirely attributable to the final construction draw-downs on Navota Plant No. 3 and the Makok C&D Center.

FCF = Operating CF ₩17.2B − CapEx ₩74.3B = −₩57.1 billion (−USD 41.1 million)

Free cash flow of negative ₩57.1 billion is the fiscal reality of late-cycle major infrastructure investment. The financing cash inflow of ₩65.8 billion — sourced primarily from short-term borrowing net increases of ₩39.9 billion and long-term drawdowns of ₩28.0 billion — essentially bridged the FCF deficit to keep the cash balance stable. Once both projects transfer to operational status in June-July 2026, the annual capex run rate should decline substantially, and FCF is expected to normalize toward positive territory in H2 2026 and accelerate through 2027.


Key Findings

Navota Export Concentration Deepens FX Sensitivity

Navota (botulinum toxin type A) remains the single most critical revenue driver at the consolidated level. Full-year 2025 Navota revenue of ₩228.9 billion (USD 164.7 million) was composed approximately 84% of export sales, and the company has achieved a 14% share of the U.S. aesthetic toxin market — a commercially significant milestone in one of the most valuable pharmaceutical segments globally. In Q1 2026, Navota export revenue of ₩42.4 billion (USD 30.5 million) represented approximately 11.2% of total consolidated revenue. This concentration creates a bilateral exposure: on the upside, incremental global market share gains in Middle East markets (10-country distribution expansion) and China entry directly lever Navota revenue with high incremental margins once Plant No. 3 is operational; on the downside, a meaningful strengthening of the Korean won versus the U.S. dollar or European currencies translates directly into revenue and margin headwinds that cannot be easily hedged at the operating level.

Hanall Biopharma Subsidiary: Growth Without Earnings Contribution

Daewoong controls 31.73% of Hanall Biopharma (009420.KS), which constitutes a material segment of the consolidated group. Hanall reported Q1 revenue of approximately ₩40.0 billion (+11% year-on-year), which demonstrates respectable top-line momentum, but operating profit was only ₩0.8 billion and net income ₩0.3 billion — margins so thin they contribute almost nothing to the consolidated bottom line. More significantly, Daewoong recognized ₩6.5 billion in equity-method losses on its Hanall stake during the quarter. This non-cash charge flows through the consolidated income statement and partially offsets gains elsewhere. Until Hanall's own clinical pipeline — primarily HL036 for dry eye disease and HL161 for autoimmune indications — generates commercial revenue at scale, this investment will continue to represent a drag on consolidated reported earnings rather than accretion.

One-Time Gain Dominates Net Income: A Reproducibility Red Flag

The ₩22.1 billion (USD 15.9 million) gain on disposal of financial assets held at fair value through profit or loss is non-recurring by definition. Management does not appear to hold a steady portfolio of such monetizable assets on a quarterly cadence. With operating profit at ₩22.2 billion, the operating and non-operating contributions to pre-tax income were almost exactly equal — an unusual configuration that effectively means "core operations" and "asset sales" contributed identical profit dollars. Investors benchmarking Daewoong on a price-to-earnings basis using Q1 2026 net income will systematically overestimate the forward earnings power of the business unless this item is explicitly excluded.

Debt Leverage at Cycle Peak

Net debt increased from ₩658.4 billion to ₩734.4 billion (USD 528.3 million) — a ₩76.0 billion (USD 54.7 million) sequential increase in a single quarter. The net debt-to-equity ratio of 38.88% is elevated relative to the company's historical comfort range but remains below levels that would threaten the A+ credit rating. The critical variable is timing: if both construction projects reach operational status on schedule in June-July 2026 and new capex commitments are limited, the debt trajectory should inflect downward in H2 2026. Any construction delays — which in Korean pharmaceutical plant projects involving cleanroom validation and regulatory inspection are not uncommon — would extend the period of maximum leverage.

R&D Pipeline Milestones Cluster in H2 2026

The R&D investment sustaining the 15.9% revenue ratio is not abstract. Specific near-term catalysts include: Bersiporocin Phase 2 data read-outs for idiopathic pulmonary fibrosis with FDA Orphan Drug and Fast Track designations providing an accelerated review pathway; the regulatory submission for Plodicitinib (veterinary atopic dermatitis) which represents an unconventional but potentially high-margin niche; and the DWJ1573 diabetes NDA submission. These milestones have the potential to generate both licensing-deal economics and approval-event re-rating of the stock, though clinical and regulatory binary risk is inherent. Failure on any of these fronts would not only eliminate the associated optionality but would also force a re-evaluation of whether the sustained R&D-to-revenue ratio of ~16% is justified.


Outlook

Daewoong Pharmaceutical enters H2 2026 at a structural inflection point. The company recorded its best-ever standalone annual performance in FY2025 — ₩1,391.0 billion in revenue and ₩203.6 billion in operating profit — and Q1 2026's margin contraction does not represent a reversal of that commercial trajectory but rather the fiscal friction of completing an exceptionally large simultaneous infrastructure investment.

The bull case centers on two time-bound catalysts. First, Navota Plant No. 3 reaching GMP-certified commercial production in H2 2026 would relieve the current supply bottleneck constraining export volume growth, directly enabling the Middle East and China distribution ramp. Second, the Makok C&D Center provides centralized research and development infrastructure that should reduce the per-program cost of late-stage clinical work over the following three to five years, partially justifying the current R&D intensity. If both assets perform as planned, the fixed-cost base that crushed Q1 2026 margins becomes a competitive moat rather than a burden, because Daewoong will have the production and R&D scale to pursue international markets that smaller-capitalization Korean peers cannot efficiently serve.

The bear case is not about demand — it is about execution risk and financial structure. Short-term borrowings of ₩176.2 billion at current interest rates create annualized interest costs that will materially exceed prior-year levels, depressing reported net income in coming quarters if operating profit does not recover. The U.S. aesthetic toxin market is attracting additional FDA-approved entrants, and Navota's 14% market share, while impressive, is not impregnable against competitors with established U.S. commercial infrastructure. Hanall Biopharma's inability to convert revenue growth into meaningful earnings contribution means the consolidated minority stake continues to dilute return on invested capital. Finally, any slippage in construction completion timelines beyond July 2026 would delay both the revenue ramp and the capex tail-off, extending the period of negative free cash flow and elevated leverage simultaneously.

The earnings quality divergence in Q1 2026 — operating profit near halved, net income up 29% — is not a signal of underlying deterioration, but it demands that investors apply a disciplined lens to the forward earnings model. The quarter is best interpreted as the final deep breath before a significant operational expansion, with the corresponding reward accruing disproportionately to investors who correctly model the H2 2026 and FY2027 normalized margin structure.


Part B: Market Impact Analysis for International Investors

The Headline Trap: Why Q1 2026 Numbers Require a Double Reading

For international investors screening Korean equities on standard financial aggregators, Daewoong Pharmaceutical's Q1 2026 numbers will present an immediately contradictory signal: operating profit down 42.6%, net income up 29.0%. Depending on which metric a given screening tool surfaces first, the same quarter could appear to describe either a company in operational distress or one delivering earnings acceleration. Neither characterization is accurate, and the gap between them is analytically significant enough to warrant a full decomposition before any position sizing decision is made.

The operating profit collapse is real, is driven by identifiable structural causes, and will partially persist through at least the next two quarters. The net income improvement is arithmetically real, is caused by a single non-recurring asset disposal, and should be excluded entirely from any forward earnings projection. Getting this distinction right is the minimum entry requirement for evaluating Daewoong at the current valuation level.

Understanding the Cost Surge: Not Mismanagement, But Investment Execution

The 13.4% increase in cost of goods sold against 6.0% revenue growth is the quantitative expression of a deliberate strategic choice: Daewoong is scaling its Navota commercial operation globally before the production infrastructure to support that scale is fully on stream. This is a sequencing problem, not a unit economics problem. When Navota is exported to the United States, Middle East, and soon China, it must be shipped with cold-chain logistics, customized packaging, and documentation that meets each market's regulatory standard. These costs are front-loaded relative to revenue recognition, particularly when entering new geographies where initial stocking orders are large but subsequent sell-through to end consumers takes time.

The input cost inflation on Erdosteine (+5.3%) and Metformin (+7.3%) is a secondary factor specific to Daewoong's branded generics and chronic disease portfolio (primarily in the domestic Korean market). These raw material cost pressures are not unique to Daewoong — they reflect broader active pharmaceutical ingredient market dynamics — but they are unlikely to reverse sharply in the near term, and they compound the margin compression from the Navota export cost structure.

For international investors benchmarking Daewoong against global botulinum toxin peers such as AbbVie (Botox) or Ipsen (Dysport), the cost structure comparison must account for scale differences. Allergan's Botox manufacturing operates at a cost structure built over decades of volume; Daewoong's Navota, with a 14% U.S. aesthetic market share achieved within a relatively short commercial window, is still moving up the experience curve. The completion of Plant No. 3 is specifically designed to address this, providing dedicated Navota production capacity at a scale that should reduce per-unit manufacturing cost materially from H2 2026 onward.

Free Cash Flow: Context Is Everything

Negative FCF of ₩57.1 billion (USD 41.1 million) in a single quarter is a number that will automatically trigger caution filters for quantitative equity strategies and some fundamental screens. In isolation, it describes a company consuming cash at an unsustainable rate. In context, it describes a company in the final spend phase of a discrete, asset-heavy investment cycle with an identifiable completion date.

The annualized capex run rate implied by Q1 2026 CapEx of ₩74.3 billion is approximately ₩297.2 billion — a figure that no Korean pharmaceutical company of Daewoong's size can sustain indefinitely. Management has been explicit that both construction projects target H1 2026 completion. The logical inference is that Q2 2026 will still carry elevated construction-period expenditure, with the sharpest drop in capex occurring in Q3 2026 once both assets enter their commissioning and validation phase rather than active construction.

For investors applying a discounted cash flow framework, the correct treatment is to model a significantly reduced capex base from H2 2026 — likely reverting to a maintenance and incremental expansion range of ₩15-25 billion per quarter rather than the current ₩74 billion — and to layer in the revenue uplift from expanded Navota production capacity and the Makok C&D Center's research throughput improvements. Under those assumptions, Daewoong's normalized FCF generation could shift materially positive within two to three quarters.

The Short-Term Borrowing Surge: Bridge Financing or a Red Flag?

The 148.9% increase in short-term borrowings — from ₩70.8 billion to ₩176.2 billion — is the liability-side development most likely to unsettle institutional investors unfamiliar with Korean pharmaceutical capital structures. The framing matters enormously here.

In Korean corporate finance practice, short-term revolving credit facilities are routinely used to bridge final construction payment tranches, particularly when long-term project financing has already been arranged but final disbursements under that financing require completion milestones that have not yet been satisfied. The fact that Daewoong's long-term debt structure was entirely unchanged during Q1 2026 — every tranche of long-term borrowings and bonds payable is flat — while short-term borrowings surged, is consistent with this bridge-financing interpretation rather than any structural deterioration in creditworthiness.

Corroborating evidence includes the maintained A+ Stable credit rating, the stable trade payables balance (indicating no distress in supplier relationships), and the fact that the incremental short-term borrowing closely approximates the incremental construction-in-progress spending during the quarter. This is not a company drawing down revolving credit to fund operating losses; it is a company drawing down revolving credit to fund the final invoices on two major capital projects.

The risk to monitor is refinancing execution: if both projects reach completion on schedule and Daewoong successfully reduces the short-term borrowing balance through either long-term refinancing or internally generated cash flow, Q3 and Q4 2026 balance sheets should show this line item normalizing. If it does not normalize by year-end 2026, the bridge-financing thesis would need to be revisited.

Navota's Global Commercial Trajectory: The Strategic Core Thesis

For any investor constructing a medium-term bull case on Daewoong, the Navota commercial trajectory is the single most important value driver, dwarfing all near-term cost pressures in magnitude of potential impact. The numbers already achieved are commercially significant: ₩228.9 billion in full-year 2025 Navota revenue (USD 164.7 million), 84% from exports, and a 14% share of the U.S. aesthetic toxin market established against the entrenched market leader in one of the most defensible premium consumer healthcare segments globally.

The U.S. aesthetic toxin market is valued at several billion U.S. dollars annually and is growing structurally, driven by both demographic expansion of the target consumer cohort and the "premiumization" of medical aesthetics as a mainstream lifestyle expenditure category. At 14% share, Navota's annualized U.S. revenue contribution (extrapolating from the export-weighted split) is approaching a scale where incremental share gains deliver meaningful absolute dollar increments to the top line.

The geographic expansion pipeline adds further dimension. Ten Middle Eastern markets are being entered through distribution agreements, representing a region with strong underlying demand for premium aesthetic medicine and limited domestic botulinum toxin production. China market entry for Navota — which requires NMPA (National Medical Products Administration) regulatory clearance, a process the company has been navigating — would represent a step-change commercial opportunity given the size of the Chinese aesthetic medicine market and the absence of a domestically preferred toxin brand. Success in China would materially alter the Navota revenue trajectory and would likely be treated as a re-rating event by the market.

Fexuclue's International Expansion: A Second Commercial Pillar Emerging

Fexuclue (fexuprazan), Daewoong's potassium-competitive acid blocker for acid-related gastrointestinal disorders, represents the second leg of the company's international commercialization strategy and is material enough to warrant separate analysis.

The gastrointestinal acid suppression market globally is dominated by proton pump inhibitors — omeprazole, esomeprazole — but P-CAB (potassium-competitive acid blocker) compounds, of which fexuprazan is one, offer pharmacokinetic advantages including faster onset and more consistent acid suppression at pH levels relevant to clinical outcomes. India and China are both large and growing markets for GI therapeutics where P-CABs have received significant prescription momentum. Fexuclue's expansion into these markets, progressing in parallel with Navota's geographic rollout, means Daewoong is simultaneously commercializing two distinct innovative products across overlapping high-growth emerging pharmaceutical markets — a more diversified international revenue structure than most mid-cap Korean pharmaceutical companies achieve.

The risk with Fexuclue is the competitive landscape: Japan's Vonoprazan (Takeda/Phathom) is the best-established P-CAB internationally and carries significant brand recognition in the physician community. Daewoong will need to compete on either clinical differentiation data, pricing strategy, or market access execution to gain meaningful share against an established P-CAB competitor with global commercialization infrastructure.

R&D Pipeline: Option Value Is Real but Binary

The 15.9% R&D-to-revenue ratio is the highest sustained investment intensity among Daewoong's comparable Korean pharmaceutical peers and is the source of both optionality and ongoing margin pressure. The pipeline assets most likely to generate investor attention in H2 2026 and into 2027 are:

Bersiporocin for idiopathic pulmonary fibrosis carries FDA Orphan Drug Designation and Fast Track Designation — two regulatory designations that collectively (1) entitle the product to seven years of U.S. market exclusivity upon approval, (2) provide eligibility for priority review and rolling NDA submission, and (3) allow more frequent FDA interaction during clinical development. IPF is a disease with a large unmet medical need despite the approval of nintedanib and pirfenidone, because both existing agents carry significant tolerability burdens. A P-CAB mechanism in IPF is novel, and positive Phase 2 signal would likely be treated by the market as validation of the entire Bersiporocin development investment. Failure would represent a meaningful write-down of capitalized development costs carried on the balance sheet.

DWP213388 for autoimmune disease in Phase 1 is earlier-stage and carries commensurately more binary risk, but the autoimmune therapeutic area commands premium licensing economics and acquisition multiples, meaning positive early clinical data could generate non-dilutive licensing deal flow.

Plodicitinib for canine atopic dermatitis is an unusual entry in a pharmaceutical pipeline but is commercially rational: the veterinary dermatology market is structurally attractive (high pet healthcare spending, prescription-driven, limited competition), and regulatory timelines in veterinary medicine are materially shorter than human medicine equivalents. The regulatory submission is near-term, making this potentially the fastest-to-revenue new asset in the current pipeline.

Hanall Biopharma: Strategic Asset or Dilutive Drag?

Daewoong's 31.73% controlling stake in Hanall Biopharma is a material component of the group's consolidated capital allocation. Hanall had an enterprise value of several hundred billion won at current market prices, meaning Daewoong's stake represents a significant balance sheet asset — but one generating negative equity-method earnings of ₩6.

NewsFinanceMarkets

Go deeper than the headline

You just read what happened. Here's how to read what it means.

Free daily briefing

The Korean market, every morning — free

LineVest Daily lands in your inbox before every Seoul open: the key KOSPI & KOSDAQ stories, earnings, disclosures and foreign flows — in plain English. Free, no card required.

Get LineVest Daily — free →
This company

Full report on Daewoong Pharmaceutical

We read Daewoong Pharmaceutical's latest DART filing in full — financials under K-IFRS, governance, and what it means for the stock. PDF in your inbox within 3 hours.

$12 · one-time

Get the Daewoong Pharmaceutical report
Every name you watch

Follow the whole market

Reading several Korean stocks a week? Read every analysis article the moment it publishes — full daily KOSPI & KOSDAQ coverage plus the 90-day archive.

$9.99 · monthly

Subscribe

Independent journalism based on primary DART filings — not investment advice. No brokerage affiliation.






