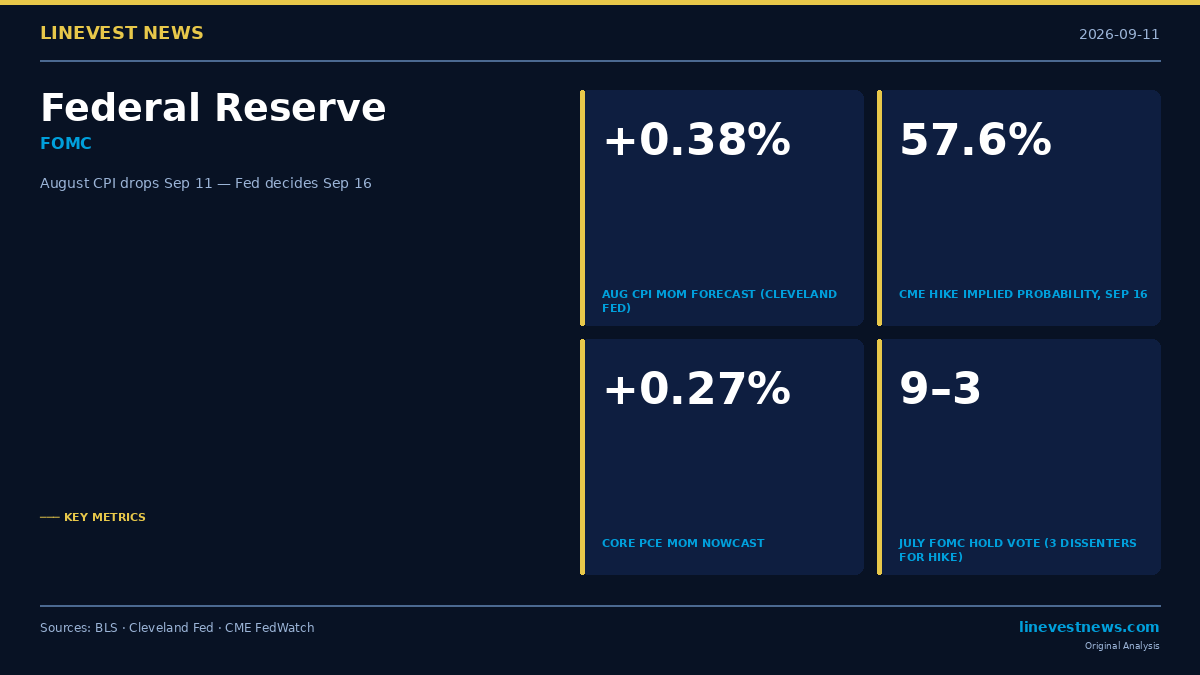
TL;DR - The Bureau of Labor Statistics releases August CPI on September 11, 2026 at 8:30 AM ET — five days before the Federal Reserve's September 16 decision (per the published BLS CPI release schedule) - Cleveland Fed Nowcasting projects a +0.38% monthly gain for August headline CPI — an acceleration from July's +0.1% — implying the year-over-year rate holds near 3.4% - CME FedWatch prices a 57.6% implied probability of a 25 bp hike at the September 15–16 FOMC meeting; the three scenarios below decompose what each CPI band implies for that probability - The Fed entered its pre-meeting blackout period on September 5 — September 11 is the most closely watched data print before the decision
Part A: The Inflation Baseline
The most recent official reading — July 2026 CPI, released August 12 — showed a modest headline deceleration driven largely by falling gasoline prices. The print matched consensus at 3.4%, while core CPI edged down to 2.5% YoY.
July 2026 CPI — Selected Components
| Metric | July MoM | July YoY |
|---|---|---|
| Headline CPI | +0.1% | +3.4% |
| Core CPI | +0.2% | +2.5% |
| Shelter (composite) | +0.1% | +3.2% |
| Energy | −1.5% | +14.7% |
| Gasoline | −2.9% | +24.6% |
| Food | +0.1% | +3.0% |
Source: Bureau of Labor Statistics, August 12, 2026.
Within shelter, hotels and motels posted a sharp monthly decline — Wolf Street analysis identified that component as one of the primary downside contributors to the report — while owners' equivalent rent (OER) and rent advanced, producing a composite shelter gain of +0.1%. Energy was the headline drag: gasoline fell 2.9% and subtracted roughly 0.09 percentage points from all-items CPI. Year-over-year, energy prices remain elevated at +14.7% — the Iran-related supply disruption has kept the annual comparison running hot even as spot prices moderated from spring peaks.
Note on rate-hike backdrop: Warsh's late-August keynote at the Kansas City Fed's annual symposium — at which he said underlying inflation had not "meaningfully improved" — lifted hike odds to roughly a coin flip before the September 4 payrolls report (+162,000 vs. 53,000 consensus, a large beat of a low consensus) pushed CME FedWatch further toward the hike side. As of the most recent data, the implied probability stands at 57.6%.
Why would the Fed tighten if core CPI is only 2.5%? Warsh has made clear he is watching headline PCE rather than core CPI, citing the risk that a prolonged supply disruption (the Iran-related energy supply shock) feeds into services prices through second-round wage effects. OER trending higher in July — and potentially a second consecutive elevated reading in August — is the data pattern consistent with that second-round transmission. The July FOMC vote of 9–3 reflects a committee that has not dismissed this risk.
What September 11 Will Show: Cleveland Fed Nowcasting
The Federal Reserve Bank of Cleveland's Inflation Nowcasting model projects the following monthly contributions for August 2026:
| Metric | MoM Nowcast |
|---|---|
| Headline CPI | +0.38% |
| Core CPI | +0.20% |
| Headline PCE | +0.36% |
| Core PCE | +0.27% |
Source: Cleveland Fed Inflation Nowcasting, as of early September 2026.
The +0.38% monthly headline nowcast is a sharp acceleration from July's +0.1%. The primary driver: energy has reversed some of June and July's decline — the nowcast implies a meaningful positive energy contribution in August consistent with gasoline prices moving higher from their summer lows. The Cleveland Fed Nowcasting model estimates August headline CPI at approximately 3.38% YoY — which rounds to 3.4% under BLS one-decimal reporting, effectively flat with July and placing the baseline in Scenario B. Note that the Scenario A threshold (rounds to 3.5%) sits only ~0.07 pp above the nowcast, so a modest upside surprise could shift the print into Scenario A territory.
Core CPI at +0.20% MoM holds steady with July's print. Core PCE MoM nowcast of +0.27% is higher than the core CPI nowcast of +0.20% in the same table. PCE weights medical care services more heavily than CPI does, which can produce a higher PCE reading when healthcare costs are rising faster than shelter. The FOMC will review both metrics; Chair Warsh has historically cited PCE as the binding gauge.
Part B: Three CPI Scenarios and FOMC Implications
The three scenarios below map CPI headline bands to their implied hike probabilities. The scenario probabilities (30/55/15) sum to 100% and represent the likelihood of each CPI band. The implied hike probabilities within each scenario are estimates; multiplying through yields: 30% × 85% + 55% × 55% + 15% × 10% = 57.25% — approximately consistent with CME FedWatch's current 57.6% (differences reflect rounding in the scenario probability estimates).
Scenario Probability Matrix
| Headline CPI Band | Prob. of this band | Implied hike probability | |
|---|---|---|---|
| A — Hot | Prints 3.5% or above | ~30% | ~85% |
| B — Ambiguous | Prints as 3.4% (or 3.2–3.3%) | ~55% | ~55% |
| C — Cold | Prints 3.1% or below | ~15% | ~10% |
Scenario A — CPI Hot (~30% chance this band; ~85% hike probability if it lands here)
CPI trigger: August headline prints as 3.5% or higher at BLS one-decimal rounding — representing a YoY reacceleration from July's 3.4%.
At 3.5% or above, the three July dissenters — Dallas Fed President Lorie Logan, Minneapolis Fed President Neel Kashkari, and Cleveland Fed President Beth Hammack — have unambiguous cover. Chair Warsh, who said in late August that underlying inflation had not "meaningfully improved," would find it politically difficult to hold. CME FedWatch hike odds would likely spike toward or past the 85% implied by the scenario matrix.
If the FOMC hikes: - 25 bp increase to target range 3.75–4.00% - 10-year Treasury yield spikes toward 4.80%+; front-end rates also rise, flattening the curve - Growth stocks (Nasdaq 100) sell off — higher discount rates compress long-duration valuations - Utilities and REITs reprice lower against a higher risk-free rate; financials see mixed effects (short-rate repricing helps loan books but a flatter curve moderates NIM expansion) - USD strengthens, pressuring commodity prices and multinationals with large overseas revenue
Scenario B — CPI Ambiguous (~55% chance this band; ~55% hike probability — near coin flip)
CPI trigger: August headline prints between 3.2% and 3.4% (inclusive) at BLS one-decimal rounding — i.e., the BLS-rounded reading is at least 3.2% but below 3.5%.
This is the Cleveland Fed Nowcast baseline. A +0.38% monthly print leaves the YoY rate effectively flat with July's 3.4%. The data is consistent with both a hike and a hold; with three vocal dissenters already on record, the committee is genuinely divided. The 57.6% CME implied probability was the calibration target for the scenario probabilities in the matrix above (which yields approximately 57.25%); within Scenario B alone, the conditional hike probability is ~55% — essentially a coin flip.
If the FOMC holds: September hike odds resolve to zero. October 27–28 hike odds remain live — likely in the 50–65% range if the dot plot signals further tightening — and front-end rates stay firm. Equity markets stage a modest relief rally (tail risk of an immediate hike priced out), but the gains are capped as October hike pricing limits the easing of financial conditions.
If the FOMC hikes: markets experience a larger shock than under Scenario A — because a Scenario B CPI is only 55% priced as a hike versus 85% under hot Scenario A, leaving a bigger unpriced surprise (45 pp vs 15 pp). 10-year yields spike and growth stocks reprice lower.
Key watch: Chair Warsh's press conference tone is the primary signal in this scenario. His language will determine whether markets treat a hold as 'one and done' or a delayed hike.
Scenario C — CPI Cold (~15% chance this band; ~10% hike probability)
CPI trigger: August headline prints as 3.1% or below at BLS one-decimal rounding.
The probability is low but non-zero. A meaningful pullback in August gasoline prices or unexpected shelter softening could produce a downside surprise. Under this scenario, hike odds for the October 27–28 meeting also compress sharply. Chair Warsh, publicly committed to data dependence, would face political difficulty issuing a hawkish statement. Headline PCE — the metric on which the FOMC's 2% target is formally defined — would remain above target even in this scenario, meaning any easing narrative would need to be caveated against still-elevated underlying inflation.
If the FOMC holds (most likely): - October 27–28 hike odds also compress — likely toward 20–25% — as the cold CPI reading provides a clear pause signal - Risk-on: S&P 500 and Nasdaq gain as the rate path reprices toward a longer pause - 10-year Treasury yield falls; bond prices rally across the curve - REITs, homebuilders, and small-caps — the most rate-sensitive segments — post the largest relative gains - USD weakens; emerging market assets and commodity prices benefit
Key Dates
| Date | Event | What to watch |
|---|---|---|
| Sep 11, 8:30 AM ET | August CPI (BLS) | Headline vs. 3.2%/3.5% thresholds |
| Sep 15–16 | FOMC Meeting | Rate decision + SEP dot plot |
| Sep 16, 2:00 PM ET | FOMC Statement | 25 bp hike or hold |
| Sep 16, 2:30 PM ET | Warsh Press Conference | October 27–28 meeting guidance |
| Sep 25 (approx., Friday) | August PCE (BEA) | PCE (headline and core) — Fed gauges |
| Oct 27–28 | Next scheduled FOMC | Potential hike if September was a hold |
Three numbers to watch on September 11: 1. Headline vs. 3.5% and 3.2% (BLS one-decimal): These are the two thresholds separating the three scenarios. A BLS-reported 3.4% — the Cleveland Fed Nowcasting baseline — keeps the September 16 decision unresolved. 2. Monthly core CPI vs. +0.20%: The Cleveland Fed nowcast holds core at +0.20% MoM. Any acceleration above that level reinforces the case for October tightening, even if September's decision is a hold. 3. OER (owners' equivalent rent) month-over-month: OER is the largest single component of the shelter index. The July report showed OER trending higher (per the BLS July CPI release). A reading in August that sustains or accelerates that trend would signal that housing disinflation has stalled — one of the factors the Fed has cited in prior pause decisions. Renewed stickiness in OER argues for tightening.
This article is published for informational purposes only and does not constitute investment advice. LineVest News is an independent financial journalism outlet not affiliated with any brokerage or investment advisory firm.
Sources: - Consumer Price Index Summary — July 2026 (BLS) - CPI Dragged Down by Energy, Hotels & Motels — Wolf Street - Cleveland Fed Inflation Nowcasting - Federal Reserve August Inflation Forecast — Yahoo Finance - Fed's Initial September Inflation Forecast — The Motley Fool - CME FedWatch September Rate Probabilities — CentralBank.Watch - September Fed Decision Now a Coin Flip — CNBC - Not So Fast on Rate Hikes, Some Fed Officials Say — Axios