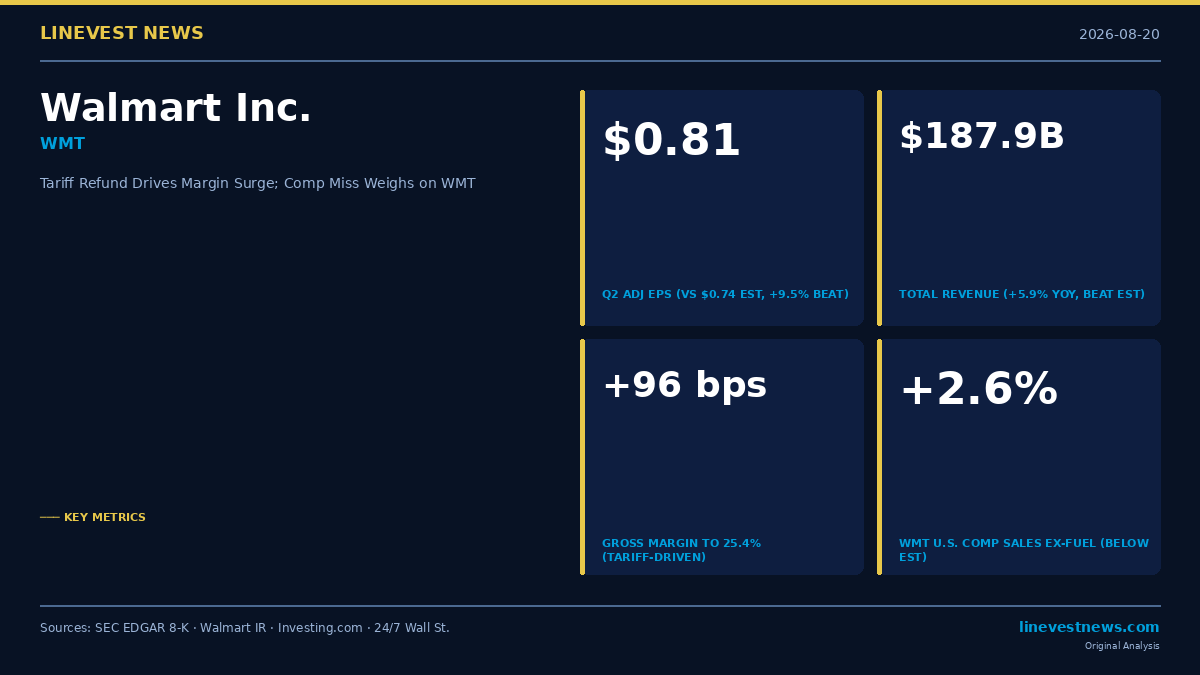
TL;DR - Adj EPS $0.81 vs $0.74 consensus (+9.5% beat); prior year adj EPS $0.68 (+19.1% YoY); GAAP EPS $0.80 - Revenue $187.9B, +5.9% YoY — beat ~$186.8B estimate by ~$1.1B - ~$2.9B in IEEPA tariff refunds drove the OI upside; ~$2.3B reinvested into lower prices, with the net OI benefit adding ~750 bps to adj CC adj OI growth - WMT U.S. comp +2.6% (ex-fuel) — below analyst expectations; 125 bps pharmacy deflation headwind - Full-year FY2027 guidance raised; adj EPS now $2.80–$2.87 (from $2.75–$2.85) - Q3 FY2027 adj OI growth guidance: +2%–4% CC — deliberately soft as remaining refunds reinvested into lower prices - WMT -3.1% intraday from its opening of $106.50 to close at $103.23
Part A — Q2 FY2027 Results
Walmart Inc. (NYSE: WMT) released its fiscal second-quarter 2027 results on August 20, 2026, for the period ended July 31, 2026. The retail giant topped adjusted EPS and revenue expectations by comfortable margins, but a ~$2.9 billion IEEPA tariff refund — duties previously paid by importers that were subsequently refunded following legal challenges to the administration's tariff authority — dominated the margin story, and shares fell roughly 3% as the market priced in the one-time nature of much of the beat.
Headline Numbers
| Metric | Q2 FY2027 | Q2 FY2026 | YoY Change |
|---|---|---|---|
| Total Revenue | $187.9B | $177.4B | +5.9% |
| Adjusted EPS (consensus beat) | $0.81 | $0.68 | +19.1% |
| GAAP EPS | $0.80 | — | — |
| Gross Margin Rate | 25.40% | 24.44% | +96 bps |
| Operating Income (GAAP) | $9.38B | $7.28B | +28.8% |
| Adj OI Growth (CC) | — | — | +17.4% |
| WMT U.S. Comp Sales (ex-fuel) | +2.6% | +4.6% | -200 bps |
| Global eCommerce Growth | +23% | — | — |
Segment Results
Note: Segment operating incomes do not sum to consolidated OI; the difference reflects corporate/unallocated expense allocations.
| Segment | Net Sales | YoY | Operating Income | YoY |
|---|---|---|---|---|
| Walmart U.S. | $125.2B | +3.5% | $8.12B | +20.6% |
| Sam's Club U.S. | $25.7B | +8.8%* | $678M | +44.3% |
| Walmart International | $35.2B | +12.8% (+7.9% CC) | $1.44B | +16.6% |
Sam's Club net sales growth includes fuel sales, which are volatile and excluded from the comparable-sales metric.
The Tariff Refund Effect
Walmart received approximately $2.9 billion in IEEPA tariff refunds during Q2. The company chose to reinvest approximately $2.3 billion into lower shelf prices and customer-facing improvements, with the remaining net operating income benefit adding approximately 750 basis points to adjusted operating income growth in constant currency.
With reported adj OI growing 17.4% in constant-currency terms, stripping out the net tariff benefit of ~750 bps implies approximately 9.9% underlying operating income growth. Management described underlying growth as being at the "top end" of their in-year guidance trajectory; stripped of the tariff contribution, the implied 9.9% sits above the 7.0%–8.5% full-year constant-currency OI growth range the company guides toward, suggesting Q2 core execution outperformed the back-half-weighted plan.
The gross margin rate expanded 96 basis points to 25.40% (from 24.44% in Q2 FY2026). The tariff refunds were the primary driver of operating income outperformance; the 96-bps gross margin expansion reflects the net tariff credit, favorable product mix, and eCommerce channel growth.
Guidance: Full Year Raised, Q3 Deliberately Soft
FY2027 Full-Year Guidance (raised August 20, 2026):
| Metric | New Guidance | Prior Guidance |
|---|---|---|
| Adj EPS | $2.80–$2.87 | $2.75–$2.85 |
| Net Sales Growth (CC) | 4.0%–5.0% | 3.5%–4.5% |
| Adj OI Growth (CC) | 7.0%–8.5% | 6.0%–8.0% |
Q3 FY2027 Guidance (deliberately compressed):
| Metric | Guidance |
|---|---|
| Adj EPS | $0.62–$0.64 |
| Net Sales Growth (CC) | 3.0%–3.75% |
| Adj OI Growth (CC) | 2.0%–4.0% |
The sharp deceleration in Q3 operating income guidance reflects a deliberate strategy: Walmart will reinvest the balance of tariff refund gains into price competitiveness ahead of the back-half selling season, compressing near-term margins in exchange for expected traffic and volume gains.
Part B — Analysis: What Investors Are Actually Pricing
The Quality-of-Earnings Debate
When a company beats earnings estimates by approximately 9.5% ($0.81 vs. $0.74 consensus), one normally expects the stock to trade up. Instead, WMT fell roughly 3.1% intraday, opening at $106.50 and closing at $103.23 on August 20. The disconnect reflects a judgment about earnings quality: a portion of the $2.9 billion tariff refund reached operating income — roughly $2.3 billion was reinvested into lower prices (the net OI benefit was ~750 bps CC adj OI growth), and the market is asking whether that level of non-recurring support is already embedded in next year's consensus.
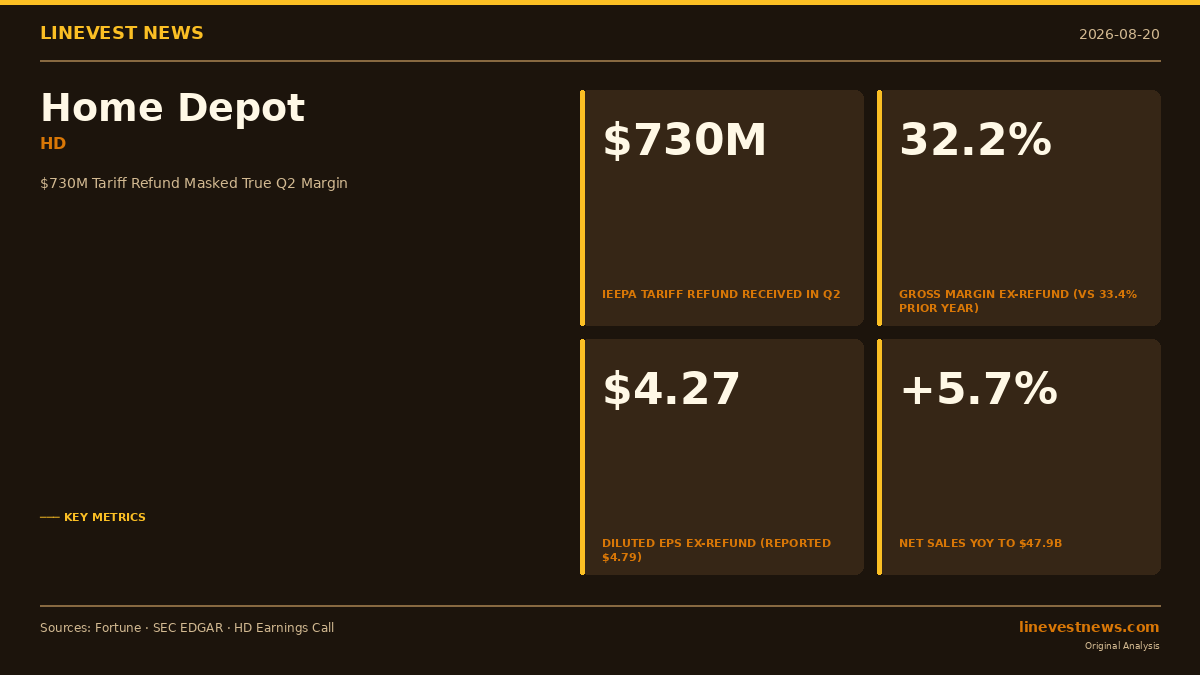
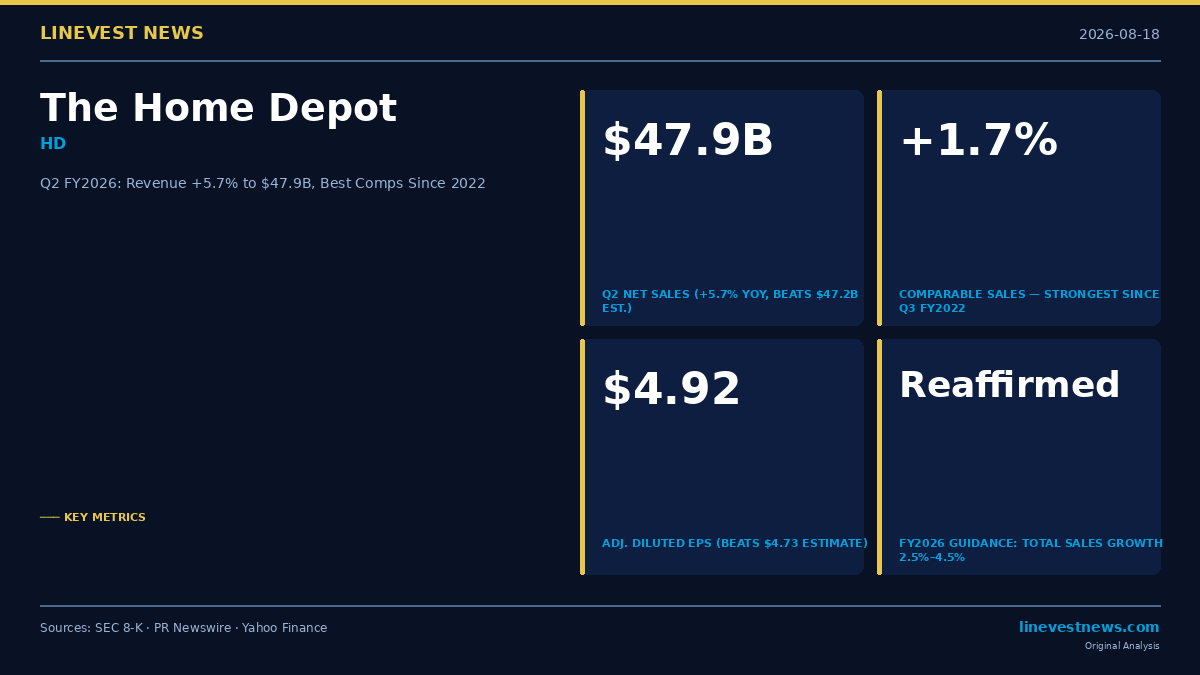
This dynamic mirrors the Home Depot Q2 FY2026 episode earlier this week, where tariff credits temporarily inflated gross margin and raised the same durability question. IEEPA tariff refunds are a broad 2026 phenomenon; what differentiates Walmart's approach is the decision to reinvest nearly 80% of the windfall into lower prices rather than booking it as profit.
The Comp Store Signal
Walmart U.S. comparable store sales of +2.6% (ex-fuel) was below analyst expectations. Management highlighted a 125-basis-point headwind from pharmacy deflation — driven primarily by GLP-1 weight-management drug pricing dynamics. Adjusting for that headwind, underlying comp performance was approximately +3.9%.
The year-over-year deceleration from +4.6% in Q2 FY2026 and the below-expectations absolute print were enough to unsettle investors who had priced in continued share-gaining momentum.
Sam's Club U.S. was the standout: +4.4% comp (ex-fuel) on 7.0% transaction growth. That combination implies an average ticket decline of approximately 2.4% — members visited more frequently for smaller baskets. Sam's Club operating income surged 44.3% to $678 million on 8.8% net sales growth. International net sales grew 12.8% (7.9% in constant currency).
The Structural Transformation Continues
Beneath the tariff noise, Walmart's structural evolution from merchandise retailer to data-and-logistics platform is advancing:
- eCommerce accelerating: Walmart U.S. eCommerce grew 24%; Sam's Club 26%; global 23%. Store-fulfilled delivery grew 40% and marketplace net sales rose 50%. Walmart's physical store footprint — historically a liability vs. Amazon's purpose-built fulfillment network — is increasingly a competitive advantage in last-mile delivery.
- Global advertising at 38% growth: Walmart Connect (U.S.) grew 43% year-over-year excluding VIZIO; broader global advertising grew 38%. Retail media carries 70–80% gross margins, making it a structurally high-value income contributor.
- Membership growing globally at 17%: Walmart+ recorded record Q2 net member additions. Sam's Club U.S. membership fee revenue grew 6%. Walmart+ and international membership programs drove the 17% global rate, with faster-growing international and Walmart+ components offsetting Sam's Club U.S.'s more moderate pace. Membership revenue is recurring, high-margin, and largely immune to merchandise cycle volatility.
The H2 Reinvestment Gambit
The most strategically significant element of today's report is how Walmart deployed the $2.9 billion refund. Rather than booking it entirely as profit, the company reinvested approximately $2.3 billion into lower shelf prices and customer-facing investments, passing the bulk of the refund back to shoppers. CFO John David Rainey indicated the company would continue this reinvestment approach through the second half of the fiscal year.
This is a deliberate margin-for-market-share trade. As the nation's largest food retailer, Walmart is betting that price leadership will drive traffic and volume gains that persist beyond the tariff-refund cycle. If competitors have less tariff exposure or choose to retain their refunds as margin, Walmart's price competitiveness improves precisely when consumers remain cost-sensitive.
The risk: if competitors received comparable refunds and respond symmetrically, the competitive benefit evaporates. The Q3 results (expected mid-November 2026) will be the first data point on whether the reinvestment is translating into comp acceleration.
Valuation After the Selloff
At $103.23, WMT trades at approximately 36x the midpoint of raised FY2027 adj EPS guidance ($2.835). That is a premium multiple for a retailer with reported full-year FY2027 adj CC OI guidance of 7–8.5% (which includes the expected tariff tailwind tapering in H2), and reflects the market's willingness to ascribe platform-like multiples to Walmart's advertising, membership, and eCommerce businesses.
The 3% intraday selloff compresses the multiple modestly. The central investment question heading into Q3 FY2027 results: can the price reinvestment strategy produce a comp store acceleration that justifies near-term margin compression? Or is underlying retail momentum fading independently of the tariff windfall?
This article is for informational purposes only and does not constitute investment advice. LineVest News is an independent publication not affiliated with any brokerage.
Sources - Walmart Q2 FY2027 Earnings Release (SEC EDGAR 8-K) - Walmart Corporate: Q2 FY27 Earnings Release - Walmart Q2 FY27 Slides: Strong Results, Raised Guidance — Investing.com - Walmart Q2 2027: Tariff Windfall Beat — 24/7 Wall St. - Walmart Q2 FY2027 Earnings — TradingKey