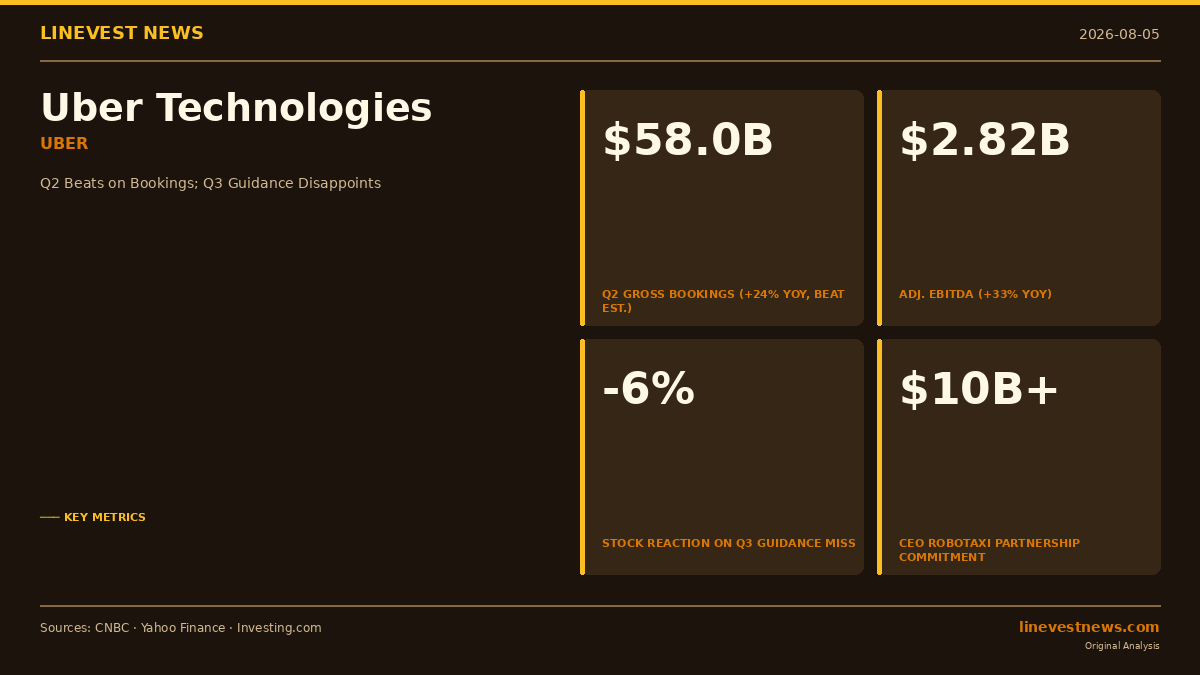
TL;DR - Uber Q2 gross bookings hit $58.0B (+24% YoY), beating the $57.23B consensus; adjusted EBITDA rose 33% to $2.82B - Q2 revenue of $14.19B missed estimates by $50M partly due to a UK accounting reclassification; non-GAAP EPS of $0.81 matched expectations - Q3 gross bookings guidance midpoint ($59.25B) barely missed consensus, while EPS guidance midpoint ($0.86) fell about 3% short — together enough to send shares down ~6% - CEO Dara Khosrowshahi pledged more than $10B in autonomous-vehicle partnerships and targeted 15 robotaxi cities by year-end, even as the Waymo relationship is being wound down
Q2 2026 Financial Results
Uber Technologies (NYSE: UBER) reported its second-quarter 2026 results on August 5, delivering record gross bookings and its first trailing-twelve-month (TTM) free cash flow above $10B — milestones the company framed as proof of durable platform leverage. But guidance for the third quarter came in slightly below Wall Street's bar, triggering a ~6% stock decline in early trading.
Key Metrics
| Metric | Q2 2026 | Q2 2025 | YoY Change | vs. Consensus |
|---|---|---|---|---|
| Gross Bookings | $58.0B | ~$46.8B | +24% | Beat ($57.23B) |
| Revenue | $14.19B | ~$12.7B | +12% | Missed ($14.24B) |
| Adjusted EBITDA | $2.82B | ~$2.12B | +33% | Beat ($2.79B) |
| Non-GAAP EPS | $0.81 | ~$0.59 | +37% | Matched ($0.81) |
| GAAP Net Income | $2.39B | $1.36B | +76% | — |
| GAAP EPS (diluted) | $1.17 | $0.63 | +86% | — |
| Trips | 3.87B | ~3.28B | +18% | — |
| Monthly Active Users | 208M | ~179M | +16% | — |
| Non-GAAP Operating Income | $2.14B | ~$1.53B | +40% | — |
| TTM Free Cash Flow | $10B+ | — | First TTM above $10B | — |
Q2 revenue growth was partly suppressed by a UK accounting reclassification that reduced reported revenue on a year-over-year basis without affecting gross bookings.
Note: Q2 gross bookings in constant-currency terms grew 22%, compared to the 24% reported growth — implying that FX was a roughly 2-percentage-point tailwind in Q2. Management has flagged an approximately 1-point headwind for Q3, marking a reversal in currency dynamics.
Segment Breakdown
| Segment | Q2 2026 Bookings | YoY Growth | Adj. EBITDA Growth |
|---|---|---|---|
| Mobility (ride-hail) | $28.99B | +22% | +28% |
| Delivery (Uber Eats) | $27.46B | +26% | +38% |
| Freight & Other | ~$1.55B | — | — |
Mobility and Delivery combined accounted for approximately $56.45B of total bookings; Freight and other segments made up the remainder. Delivery bookings growth outpaced Mobility for the second consecutive quarter on an organic basis — the July 2026 acquisition of Delivery Hero's Baemin and foodpanda for $14.8B closed after Q2 ended and will begin affecting Delivery segment figures in Q3.
Q3 2026 Guidance vs. Estimates
| Metric | Company Guidance | Analyst Consensus | Gap |
|---|---|---|---|
| Gross Bookings | $58.25B – $60.25B | ~$59.33B | Midpoint $59.25B — slight miss (~0.1%) |
| Non-GAAP EPS | $0.84 – $0.88 | $0.89 | Midpoint $0.86 — miss (~3.4%) |
Management cited approximately 1 percentage point of foreign-exchange headwind embedded in Q3 bookings growth. Adjusting for that, Q3 constant-currency growth would be in the mid-to-high 20s — broadly consistent with Q2 trends.
Why Shares Fell Despite a Strong Quarter
The market's -6% reaction on August 5 reflects a well-documented pattern with Uber: consensus expectations have been calibrated for beats on every line, so guidance that misses — even narrowly on bookings and more noticeably (~3.4%) on EPS — reads as a caution signal.
Three specific concerns weighed on sentiment:
Take-rate compression. At $14.19B revenue on $58.0B in gross bookings, Uber's implied take rate is approximately 24.5% — down from roughly 27% in the prior-year period. Analysts are watching whether this ratio can recover back toward its historical mid-to-upper-20s range. A persistently lower take rate would suggest that competitive discounting or incentive payments are eroding the profitability of each incremental booking dollar.
$10B robotaxi commitment without a timeline — and a Waymo unwind. Khosrowshahi's announcement that Uber will invest "more than $10 billion" in autonomous vehicle partnerships is strategically bold. However, it arrives alongside confirmation that the company's highest-profile AV partnership — with Waymo — is being wound down. The pivot to new partners (Wayve in London, Lucid, Rivian, Nissan) diversifies AV supply but introduces execution uncertainty for a thesis that has been central to the Uber bull case.
FIFA World Cup tailwind partially shared with Q3. The CEO credited the 2026 FIFA World Cup — hosted across U.S., Canadian, and Mexican cities — with generating more than 8 million tourist rides. With the tournament extending through mid-July, Q3 captures the knockout rounds and final (a partial tailwind), while Q4 will be the first quarter with no World Cup benefit at all. The full year-over-year deceleration in the travel and tourism demand boost will therefore be felt most sharply in Q4 2026 and Q1 2027.
Investment Angle: Platform Leverage vs. AV Disruption Risk
For investors, Uber's Q2 report surfaces a tension that will define the stock's trajectory over the next 12–18 months: the company is demonstrating genuine operating leverage — EBITDA growing 33% on 24% bookings growth, with TTM free cash flow crossing the $10B mark for the first time — yet it is simultaneously choosing to deploy that cash into autonomous vehicle partnerships whose economics and competitive dynamics remain unsettled.
Bull case: Uber's 208 million monthly active users and 3.87 billion quarterly trips create a demand-aggregation moat that no AV hardware maker can replicate cheaply. If robotaxi unit economics improve, Uber's platform position means it captures a disproportionate share of volume without owning vehicles. The $10B commitment locks in favorable supply agreements before AV technology matures.
Bear case: The Waymo unwind suggests that leading AV companies are increasingly willing to build consumer habits independent of the Uber app. If Waymo, Tesla's robotaxi service, and others successfully go direct-to-consumer, the platform moat erodes over time. Meanwhile, the Delivery Hero acquisition adds $14.8B of debt-funded exposure to international food delivery — a market with structurally thin margins — at a time when capital efficiency should arguably be the priority given the AV spending commitment.
Key metrics to watch in Q3: - Take rate (revenue ÷ gross bookings) — any stabilization above 24% would address monetization concerns - AV trip volume in the 15 target cities — first proof point for the robotaxi thesis - Delivery Hero integration update — management has not yet quantified cost or revenue synergies - TTM free cash flow trajectory — whether the $10B run rate is maintained as capital deployment accelerates
Sources
- Yahoo Finance — Uber Q2 2026 Earnings Overview
- Yahoo Finance — Uber Stock Drops, Robotaxi Strategy
- Investing.com — Q3 Guidance Miss Analysis
- CNBC — Uber Stock Q2 2026
This article is for informational purposes only and does not constitute investment advice. LineVest is an independent financial news publisher, not a registered investment adviser.