
Marathon Petroleum (MPC) Q2 2026: Operating Income Triples to $7.3B
Marathon Petroleum's second quarter was a supply-shock windfall, not a step-change in earning power. Operating income tripled to $7,322 million from $2,197 million, and net income attributable to MPC rose to $5,138 million from $1,216 million.
Trade Desk (TTD) Q2 FY2026: Revenue +3%, Operating Income -13% — Q3 Guidance of $650M Sends Shares Down 21–24%
Trade Desk posted Q2 FY2026 revenue of $715.1 million, up 3.0% year over year, missing the Zacks consensus of $751.6 million by 4.9%. Operating income fell 13.0% to $101.6 million.
Lam Research (LRCX) FY2026: Revenue +26% to $23.2B; FCF -10%
Lam Research finished fiscal 2026 with cycle-high margins and the weakest cash conversion in years — and both facts come from the same source. Revenue rose 26.0% to $23.23 billion and gross margin reached 50.5% GAAP; free cash flow fell 9.7% to $4.89 billion as a $1.96 billion receivables build and a reversal in deferred profit hit cash conversion simultaneously.
FedEx (FDX) FY2026: Revenue $94.7B, +7.7%; Operating Margin Falls — Freight Spinoff, Fiscal Year Change, Supply Chain Sale
Executive Summary
Regeneron (REGN) Q2 2026: Sanofi Profit Share +59% as EYLEA HD Overtakes Legacy EYLEA
Regeneron's GAAP earnings per share fell again in the second quarter, yet the operating business grew at its fastest pace in years. Revenue rose 16.7% to $4.29
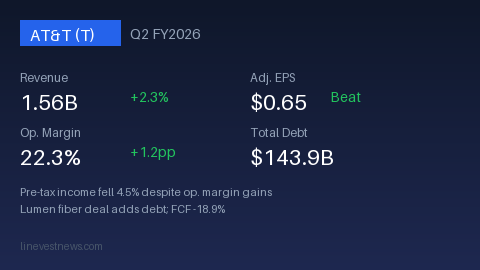
AT&T (T) Q2 FY2026: Adjusted EPS $0.65 Beats Consensus, but Pre-Tax Income Falls 4.5% as Interest Costs and DirecTV Income Exit Create a $742M Below-the-Line Drag
AT&T Q2 2026: revenue $31.56B (+2.3%), operating margin 22.3%, adjusted EPS $0.65 beat consensus $0.59. Pre-tax income fell 4.5% as interest expense rose 13.8%
Xcel Energy (XEL) Q2 FY2026: Net Income +32% on Revenue -5% — Nuclear Life Extension Cuts Depreciation; H1 CapEx +35%, Interest Expense +27%
Xcel Energy, a regulated utility operating across the Midwest, Mountain West, and Southwest, posted an unusual second quarter in 2026: profits rose even as revenue declined.
AT&T (T) Q2 FY2026: Revenue $31.56B, Margin 22.3%; Pre-Tax Income -4.5%, Debt $143.9B on Lumen Deal
AT&T, one of the three largest U.S. telecom carriers, reported Q2 FY2026 total revenue of $31.56 billion (+2.3% YoY) and operating income of $7.04 billion (+8.3
Sempra (SRE) Q2 2026: GAAP EPS Jumps 70%, but Adjusted EPS Rises 30% as Sempra Infrastructure Leads the Quarter
Sempra's second-quarter GAAP earnings jumped while revenue did not move at all. Earnings attributable to common shares reached $796 million versus $461 million a year earlier, though on an adjusted basis the gain was a more modest 30%, from $583 million to $762 million.
CME Group (CME) Q2 2026: Market Data +20% Offsets Clearing Fee Decline; $4.4B H1 Shareholder Returns
CME Group reported Q2 2026 revenue of $1.706 billion, up 0.8% year over year. Clearing and transaction fees — the company's primary revenue line — contracted 2.5% to $1.353 billion from $1.388 billion, but market data revenue surged 20.2%, offsetting the decline.
Home Depot (HD) Q2 FY2026: $685M Tariff Refund Masks a 6% Profit Drop
Home Depot's headline numbers improved, but less than half of the revenue increase came from selling more home improvement goods. Consolidated net sales rose 5.7% to $47.86 billion, yet the GMS acquisition contributed $1.4 billion of the $2.58 billion increase, foreign exchange added $105 million, and a $685 million tariff refund flowed through cost of goods sold rather than demand.
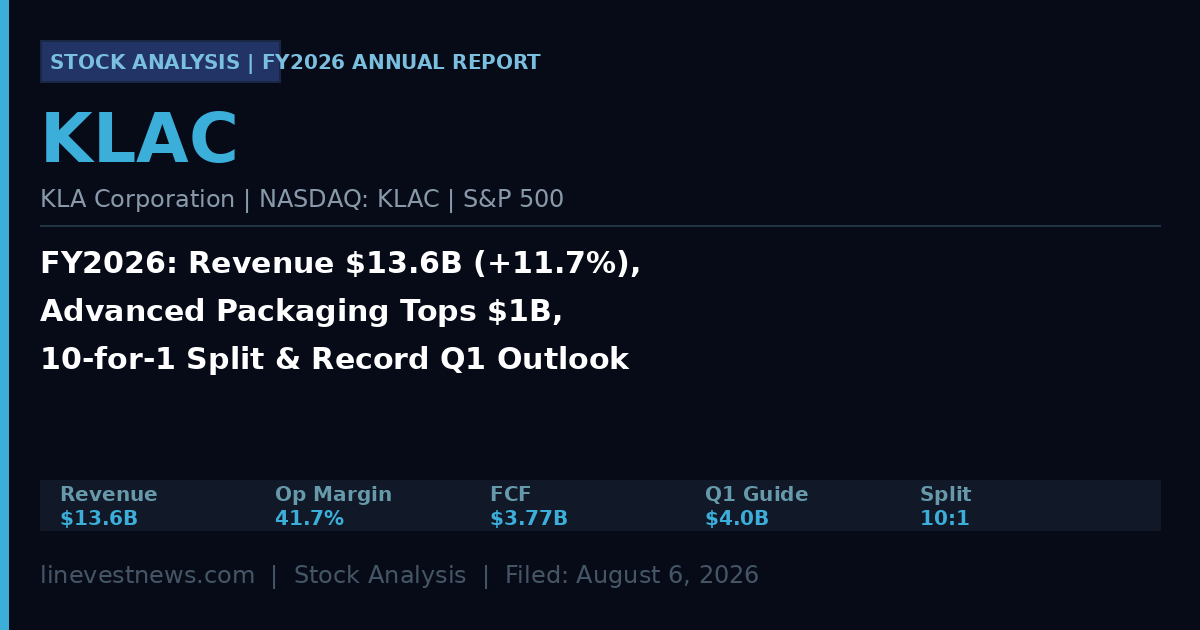
KLA Corporation (KLAC) FY2026 Annual Report: Revenue Hits $13.6B, Advanced Packaging Crosses $1B Milestone, 10-for-1 Split Opens AI Equipment Leader to Retail
KLA Corporation FY2026 annual results: revenue $13.6B (+11.7% YoY), operating margin 41.7%, FCF $3.77B. Advanced packaging revenue hits $1B milestone (+57% YoY). 10-for-1 stock split June 2026. Q1 FY2027 guided to record $4.0B. WFE market raised to $140B+.