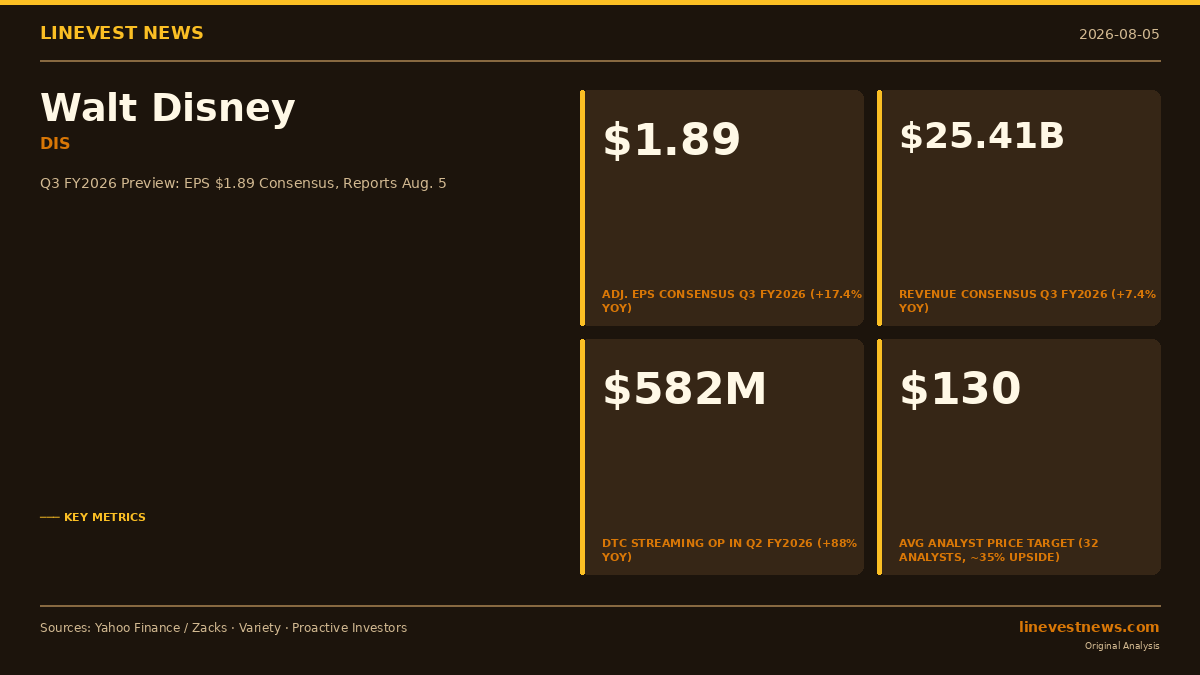
TL;DR - Walt Disney (NYSE: DIS) reports fiscal Q3 2026 results on August 5, 2026, before market open; earnings call at 8:30 a.m. ET - Consensus: adjusted EPS $1.89 (+17.4% YoY from $1.61) on revenue of $25.41 billion (+7.4% YoY) - Three watch points: streaming direct-to-consumer (DTC) margin expansion, theme parks resilience against Universal's Epic Universe, and ESPN sports operating income trough - DIS has declined roughly 20% over the past 52 weeks; 32 analysts average a $130 price target, implying approximately 35% upside from current levels near a 52-week low
Part A: What Wall Street Expects
Headline Consensus (Q3 FY2026 vs. Q3 FY2025)
| Metric | Q3 FY2026 Consensus | Q3 FY2025 Actual | YoY Change |
|---|---|---|---|
| Adjusted EPS | $1.89 | $1.61 | +17.4% |
| Revenue | $25.41B | ~$23.67B | +7.4% |
| FY2026 Full-Year Adj. EPS Guidance | $6.85 | $5.93 | +15.5% |
Disney has exceeded Wall Street's earnings expectations in each of the four preceding quarters.
Segment Revenue Forecasts (Q3 FY2026)
| Segment | Q3 FY2026 Estimate | YoY Change |
|---|---|---|
| Entertainment | $11.78B | +10.1% |
| Sports (ESPN) | $4.55B | +5.7% |
| Experiences (Parks & Resorts) | $9.74B | +7.2% |
| Total Revenue | ~$25.41B | +7.4% |
Source: Zacks/Yahoo Finance analyst consensus as of August 4, 2026.
Parks & Experiences Detailed Forecasts (Q3 FY2026)
| Metric | Q3 FY2026 Estimate | YoY Change |
|---|---|---|
| Theme Park Admissions | $3.08B | +2.9% |
| Parks Merchandise, Food & Beverage | $2.19B | +2.1% |
| Resorts & Vacations | $2.88B | +21.4% |
| Domestic Hotel Occupancy | 85.5% | -0.5pp |
Most Recent Quarter Baseline: Q2 FY2026 (ended March 29, 2026)
| Segment | Revenue | Operating Income | YoY (OP) |
|---|---|---|---|
| DTC Streaming (Disney+/Hulu) | $5.49B (+13% YoY) | $582M (10.6% margin) | +88% |
| Experiences (Parks) | $9.50B (+7% YoY) | $2.60B | +5% |
| Sports (ESPN) | $4.61B (+6% YoY) | $652M | -5% |
| Total | $25.17B | — | +7% |
Disney also guided for double-digit adjusted EPS growth in fiscal 2027, underpinned by streaming profitability.
Part B: Three Watch Points for Investors
Watch Point 1: DTC Streaming — Can the 10.6% Margin Floor Hold?
Disney's direct-to-consumer entertainment streaming segment crossed a milestone in Q2 FY2026, with a 10.6% operating margin—the first quarter the combined Disney+/Hulu business broke into double-digit profitability. Operating income surged 88% year-over-year to $582 million, fueled by price increases implemented in fall 2025 and reduced churn on the integrated Disney+/Hulu platform.
The central question for Q3 is whether this momentum continues into a seasonally lighter content window before Disney's fall slate begins. Analysts are watching two sub-drivers: (1) average revenue per user (ARPU) expansion via ad-supported tier adoption and price discipline, and (2) content cost management. If streaming margins narrow sequentially from 10.6%, doubts could arise about the profitability trajectory that underpins management's fiscal 2027 guidance.
Market participants will also watch for an update on ESPN Flagship—Disney's planned standalone direct-to-consumer ESPN streaming service. A concrete launch timeline or major distribution partnership could serve as a meaningful positive catalyst, given ongoing uncertainty about ESPN's transition away from its legacy linear cable revenue model.
Watch Point 2: Experiences — Resilience Against Universal's Epic Universe
The Experiences segment has served as Disney's cash engine through the streaming investment cycle. Q2 FY2026 Experiences revenue reached $9.5 billion—a Q2 record—and operating income of $2.6 billion rose 5% year-over-year. However, domestic park attendance slipped 1% in Q2 even as global attendance grew 2%.
For Q3 (Disney's peak summer quarter), analysts expect Experiences revenue of $9.74 billion (+7.2%). The resorts and vacations component is forecast to surge 21.4% to $2.88 billion, suggesting strong advance bookings. However, per-capita guest spending is estimated at +3.0%—a sharp deceleration from the +8.0% comparison in the year-ago quarter—reflecting moderated pricing power after several years of aggressive ticket and food price increases.
The key competitive wildcard is Universal's Epic Universe, which opened near Orlando in May 2026. While Disney management indicated that domestic Q3 attendance would improve from Q2's 1% decline, Epic Universe directly competes for central Florida vacation spend. Investors will scrutinize domestic attendance figures and any forward commentary on competitive dynamics.
Longer-term, Disney has committed approximately $60 billion in Experiences capital spending through fiscal 2033, suggesting management remains confident in demand—but rising labor and construction costs represent an ongoing watch point for operating leverage.
Watch Point 3: ESPN Sports — Q3 Trough Before Full-Year Recovery?
The Sports segment (ESPN, ESPN+) presents the most complex narrative. In Q2 FY2026, Sports revenue rose 6% to $4.61 billion, but operating income fell 5% to $652 million due to elevated programming rights costs. Management guided for a mid-double-digit year-over-year decline in Sports operating income in Q3, driven by the timing of sports rights cost renewals.
Despite the Q3 pressure, Disney maintained its full-year FY2026 Sports operating income guidance for mid-single-digit growth, implying a meaningful Q4 recovery as programming cost comparisons ease. The market will assess whether this recovery remains on track or whether live sports rights inflation—a sector-wide trend—is creating a more structural margin compression problem for ESPN.
ESPN's long-term value ultimately hinges on its evolution into a streaming-first sports destination. The Flagship direct-to-consumer ESPN service, once launched, would represent the most significant product transformation in the network's history and could unlock cord-cutters as a new subscriber base. Management updates on launch timing will be closely watched.
Separately, Disney announced corporate layoffs across Pixar, ESPN, National Geographic, and Disney Entertainment Television in July 2026, an indication that management is actively working to reduce the cost structure across segments ahead of this earnings print.
Valuation and Analyst Positioning
DIS shares have significantly underperformed the broader market: down approximately 20% over the past 52 weeks versus the S&P 500's roughly 19% gain over the same period. The stock is near a 52-week low heading into Q3 results, after a multi-month losing streak.
Nevertheless, analyst sentiment remains broadly constructive. Of 32 analysts covering Disney:
| Rating | # of Analysts |
|---|---|
| Strong Buy | 23 |
| Moderate Buy | 4 |
| Hold | 4 |
| Strong Sell | 1 |
| Total | 32 |
| Average Price Target | $130 |
The average $130 price target implies approximately 35% upside from current levels. The stock's compressed valuation—driven by concerns about ESPN's structural transition, parks demand moderation, and streaming profitability sustainability—represents either a value opportunity or a sign that the market perceives Disney's multi-year transformation as more costly and uncertain than management projects.
Noteworthy: analyst EPS estimates were revised downward approximately 1.8% in the 30 days preceding the Q3 release, reflecting cautious positioning ahead of the Sports segment headwind.
Key Risks
- Parks demand elasticity: After years of above-inflation price increases, domestic attendance growth has stalled; Epic Universe adds a new competitive pressure in Disney's largest market.
- Sports rights cost inflation: Live sports rights renewal costs are rising industry-wide; ESPN's profitability depends on locking in favorable multi-year deals and migrating subscribers to ESPN Flagship.
- Streaming competition: Netflix, Amazon Prime Video, and Apple TV+ continue to invest heavily in content; sustaining Disney+/Hulu subscriber retention requires ongoing high-quality releases.
- China revenue headwind: Greater China remains below historical norms due to geopolitical tensions and reduced international tourism to Disneyland Hong Kong and Shanghai Disney Resort.
This article is for informational and journalistic purposes only and does not constitute investment advice or a recommendation to buy, sell, or hold any security. All estimates are based on third-party analyst consensus data and are subject to revision.
Sources
- Disney Streaming Margins and Parks in Focus Ahead of Earnings — Proactive Investors / Yahoo Finance
- Stay Ahead of Disney Q3 Earnings: Wall Street Key Metrics — Yahoo Finance
- What You Need to Know Ahead of Disney Earnings — Yahoo Finance
- Disney Q2 FY2026: Revenue Rises 7%, Streaming Profit Soars 88% — Variety
- Disney Q2 Beats as Streaming Profit Soars 88% — HeyGoTrade
- Disney Stock at 52-Week Low: Q3 Preview — TopOne Markets
- Should You Buy Disney Stock Before Aug. 5? — The Motley Fool