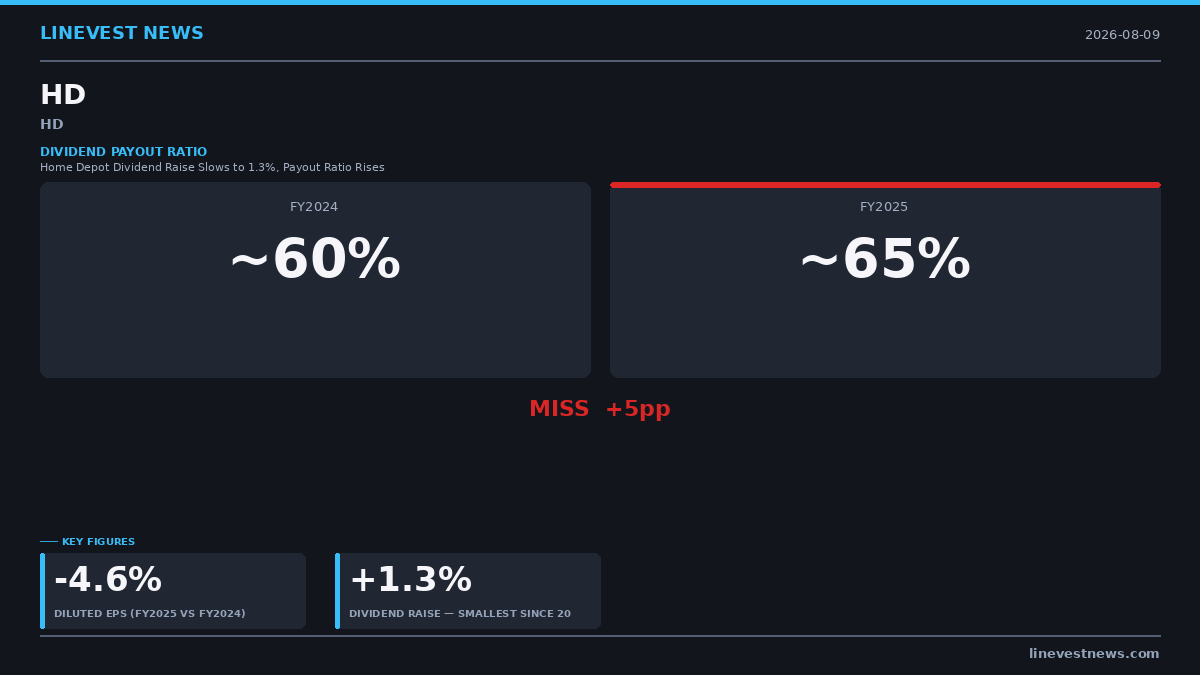
Home Depot (NYSE: HD) lifted its quarterly dividend by 1.3% in February, the smallest annual increase in the dividend history the company publishes back to 2020. The share of earnings going out the door as dividends rose anyway — from roughly 60% to roughly 65% in a single year — because per-share earnings fell faster than the dividend climbed.
The first of those sentences is the company's own wording. The second appears nowhere in the earnings release; it comes from setting the company's published figures next to one another. Together they are the thing worth carrying into the second-quarter report Home Depot will deliver before the U.S. market opens on Aug. 18.
What the board actually approved
The increase was disclosed in the fiscal 2025 fourth-quarter release, attached as an exhibit to an 8-K — the SEC filing companies use to disclose material events — on Feb. 24. The wording is the board's own, and it is worth reading before anyone paraphrases it:
"Its board of directors approved a 1.3% increase in its quarterly dividend to $2.33 per share, which equates to an annual dividend of $9.32 per share."
The same document reports the year that dividend is being paid out of:
- Net sales: $164.7 billion, up 3.2%
- Comparable sales: up 0.3%
- Diluted earnings per share: $14.23, down 4.6%
- Operating margin: 12.7%
- Fiscal year length: 52 weeks
So the dividend rate went up while the earnings it is paid from went down. A payout ratio can rise for two entirely different reasons, and the distinction matters more than the level does. A board can decide to hand shareholders a larger slice of a growing pie, which is a statement of confidence. Or the pie can shrink underneath a slice that barely moved, which is not a decision at all. Home Depot's is the second kind.
Here is that arithmetic, using the declared per-share rate in force each year rather than cash actually disbursed, which shifts slightly on payment timing:
| Fiscal year | Annual declared rate | Diluted EPS | Payout |
|---|---|---|---|
| 2024 | $9.00 | $14.91 | ~60% |
| 2025 | $9.20 | $14.23 | ~65% |
| 2026 (guided) | $9.32 | $14.23–$14.80 | ~63–65% |
The fiscal 2024 earnings figure comes from the fourth-quarter release filed with the SEC in February 2025. The rest is management's own guidance, reaffirmed in May: diluted earnings per share "to grow approximately flat to 4.0%" from the fiscal 2025 base.
Read the bottom row carefully. Even if earnings land at the very top of the range management is guiding to, the payout ratio only returns to roughly where fiscal 2024 left it plus a couple of points. The best case in the company's own forecast is a payout ratio that falls back — though not all the way to where fiscal 2024 left it.
Why it matters
A dividend increase is one of the few forward-looking statements a board makes without using words. It commits real cash on a recurring schedule, it is awkward to reverse once shareholders have grown used to it, and unlike a forecast it cannot be quietly revised next quarter. The size of a raise often carries more information than the fact of one.
What makes this one worth pausing over is not the small percentage but the direction of the ratio behind it. When a payout ratio climbs because a board has deliberately widened the share of profits it hands back, the move reads as confidence. When it climbs because the earnings underneath slipped while the payment inched ahead, nobody decided anything at all — the arithmetic simply moved. Telling those two cases apart cannot be done from the headline percentage alone.
For a retailer whose results are widely read as a barometer of home-improvement demand, that distinction travels further than a single line in a dividend table. It is a quiet statement about how a management team views the durability of its own cash generation, made in a currency harder to walk back than any sentence in a press release.
Four years of deceleration
Home Depot publishes its declared quarterly rate by year on its investor-relations dividend history page. Converted into year-over-year increases, the deceleration since 2023 is not subtle:
| Year declared | Quarterly rate | Increase |
|---|---|---|
| 2020 | $1.50 | +10.3% |
| 2021 | $1.65 | +10.0% |
| 2022 | $1.90 | +15.2% |
| 2023 | $2.09 | +10.0% |
| 2024 | $2.25 | +7.7% |
| 2025 | $2.30 | +2.2% |
| 2026 | $2.33 | +1.3% |
Percentages for 2021 onward are calculated from the per-share rates on that page; the 2020 figure requires the implied prior-year quarterly rate of approximately $1.36, which predates the published history. The two most recent increases are also stated verbatim in the corresponding fourth-quarter releases.
Four consecutive years of smaller raises is a different signal from one cautious year. A board that expects earnings to re-accelerate has a cheap way to say so without committing to anything specific, and holding the dividend growth rate steady is that way. Choosing the smaller number instead is a statement about the durability of cash generation — made quietly, months before the quarters that would test it.
It is also worth being precise about what the company itself claims here, because the secondary coverage has drifted. The February filing counts quarters of payment, not years of increase: "This is the 156th consecutive quarter the Company has paid a cash dividend."
The May 21 declaration release, which set the $2.33 payment for June 18, updated that count to the 157th — the next quarter in the same sequence.
Nowhere in either document does Home Depot claim a streak of consecutive annual increases. That framing is a third-party construction rather than a disclosed fact, and the company's own language — quarters paid, not years raised — is the one to work from.
The quarter that set it up
Home Depot's first quarter of fiscal 2026, reported on May 19, is where the tension becomes visible. The headline numbers and the underlying ones point in different directions:
- Total sales: $41.8 billion, up 4.8%
- Comparable sales: up 0.6% (U.S. up 0.4%)
- Comparable customer transactions: down 1.3%
- Average ticket: $92.76, up 2.3% (company-wide)
- Net earnings: $3.289 billion, down 4.2%
- Diluted EPS: $3.30, down 4.3%
Read in sequence, the story assembles itself without commentary. The top line grew several times faster than the existing store base did, meaning most of the growth came from square footage and businesses outside the comparable base — the same release attributes $119 million of intangible amortization to SRS Distribution, a building-products distribution operation consolidated into Home Depot's results.
Inside the comparable base, fewer customers came through the door. The $92.76 average ticket, up 2.3%, is a company-wide figure rather than a comparable-base one. That is growth bought with footprint and with price, not with traffic. It is an ordinary way for a mature retailer to grow, and also the hardest version to keep compounding: the price component eventually meets what customers will tolerate, and the footprint component costs capital.
And none of it reached the bottom line. Net earnings and per-share earnings both declined even as sales advanced — a 4.8% sales gain and a 4.2% earnings decline, nine percentage points of divergence absorbed somewhere between the register and the bottom of the income statement.
One detail in that comparison is easy to skip. Diluted earnings per share fell slightly more than net income did, because the diluted weighted average share count rose to 996 million from 994 million a year earlier.
When a company is retiring stock, the relationship usually runs the other way: buybacks shrink the count, and the per-share line lands better than the dollar line. Here there was no cushion, and a slightly larger count made the per-share decline slightly worse. The capital-return lever that flatters many mature-company earnings reports was not pulled in this one.
What the raise costs, and what it competes with
The increase itself is trivially small in absolute terms. Three cents a quarter is twelve cents a year, and against roughly 996 million shares outstanding that is about $120 million of extra annual cash.
Set that against what the dividend already costs. At the $9.32 annual rate the full payout runs to roughly $9.3 billion a year — so the raise adds a little over one percent to a bill the company was already carrying. The same guidance package calls for net interest expense of approximately $2.3 billion, which makes the dividend about four times the interest bill.
None of that is distress, and the company is not signaling any. It is simply the reason a board might prefer a three-cent raise to a twenty-cent one in a year when comparable sales are guided to a range that starts at zero. A dividend is a promise that is expensive to break, and the cheapest way to preserve room to maneuver is to grow it slowly rather than to grow it and then have to defend it.
What Aug. 18 settles
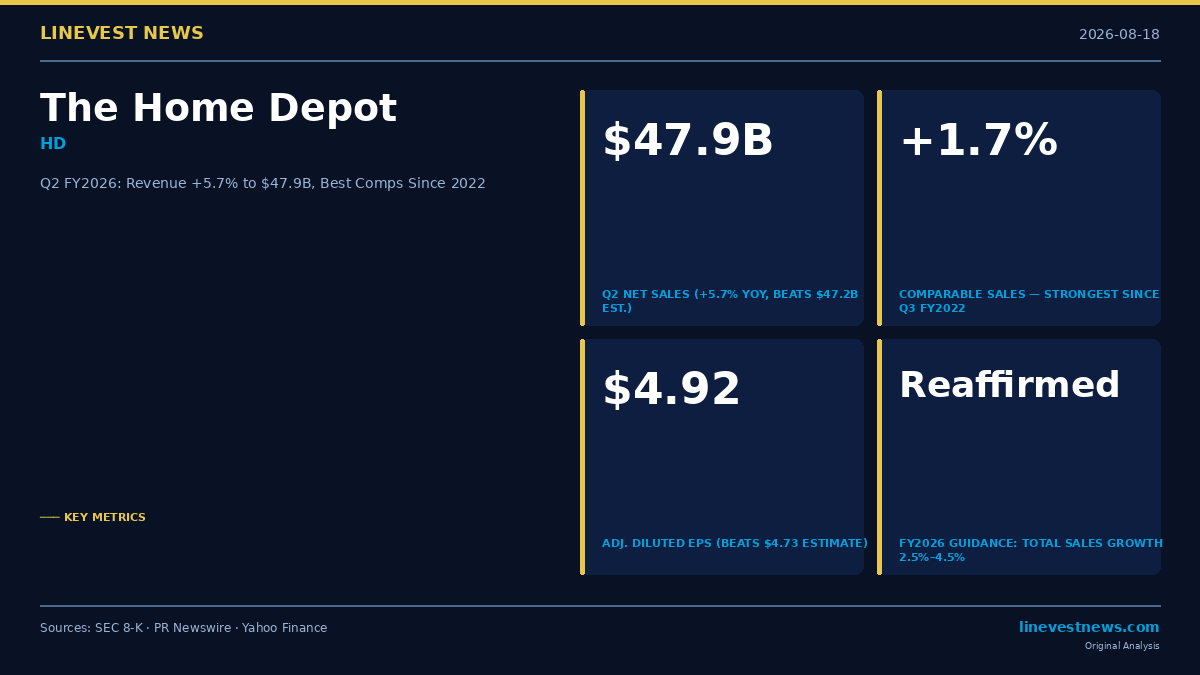
Consensus for the second quarter is diluted EPS of $4.71, against $4.68 in the year-ago quarter, per a Barchart earnings preview carried on Yahoo Finance. That is not a quarter capable of changing the trajectory in either direction on its own.
The informative lines will be elsewhere: the comparable sales figure, the direction of transaction counts, and whether the full-year range survives contact with a second quarter. Management reaffirmed that range in the May 19 first-quarter release, and the lines below are quoted from the fiscal 2026 guidance in that release:
- Total sales growth: approximately 2.5% to 4.5%
- Comparable sales growth: approximately flat to 2.0%
- Operating margin: approximately 12.4% to 12.6%
- Capital expenditures: approximately 2.5% of total sales
One of those lines is easy to misread. The capital-expenditure figure is a budgeting ratio against Home Depot's own sales — what it plans to reinvest out of every dollar it rings up — not a share of any market. All four come from the company, not from an outside estimate of its standing against competitors.
A quarter that puts comps in the upper half of that band, with transaction counts turning positive, recasts the small raise as one year of caution that has already done its job.
Sources
- Home Depot 10-Q (Q1 FY2026, period ending May 3, 2026) — SEC EDGAR
- Home Depot Investor Relations — Dividend History
- Home Depot Investor Relations — News Releases (Aug 4, 2026 Q2 conference call announcement)
- Yahoo Finance — Home Depot Dividend vs Walmart Comparison (Aug 8, 2026)
All financial data sourced directly from SEC filings and company investor relations materials. This article is journalistic analysis, not investment advice.