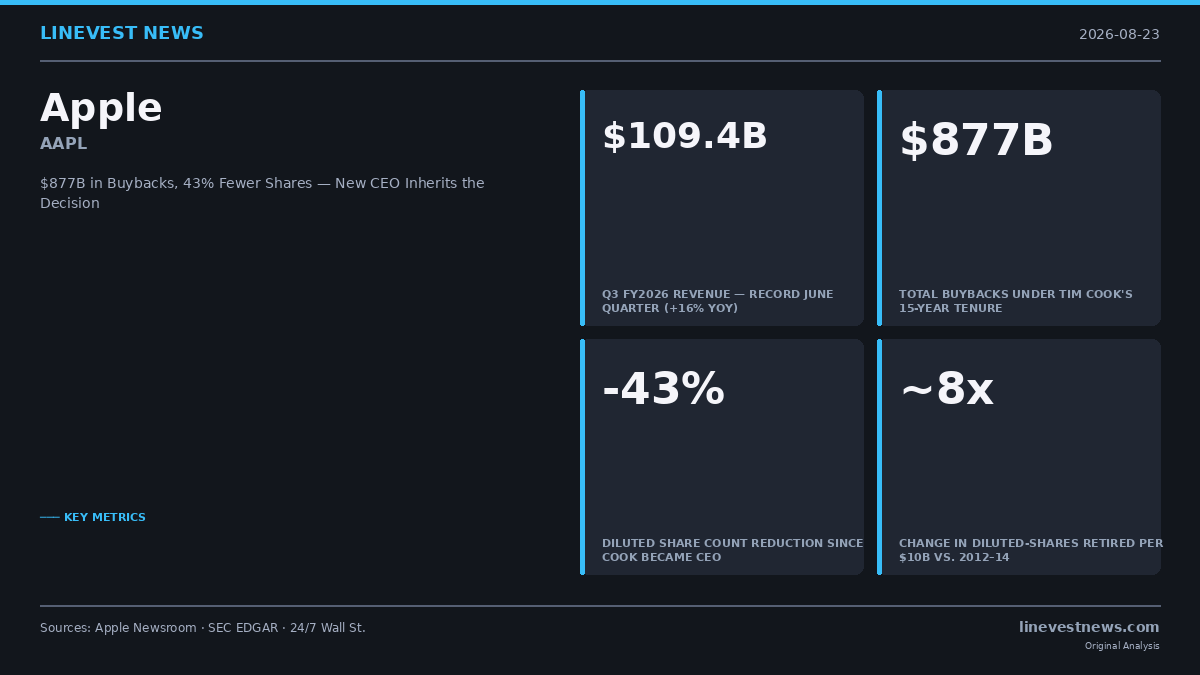
TL;DR - Apple Q3 FY2026 (June quarter): $109.4B revenue (+16% YoY, record), $29.8B net income; Tim Cook's final earnings call as CEO - Apple returned ~$29.8B to shareholders in Q3 (~$25.8B buybacks + ~$4.0B dividends); nine-month total buybacks: $62.1B - Under Cook's 15-year tenure, Apple spent ~$877B repurchasing its own stock — diluted shares outstanding fell ~43% (from ~26B to ~14.75B) - At ~$235 per share today, $10B retires ~0.29% of diluted shares outstanding; at ~$16.50 (split-adjusted) in 2012–14, the same $10B retired ~2.4% — approximately an 8-fold change over more than 12 years
Apple Inc. (AAPL) closed the Tim Cook era of quarterly earnings calls on July 30, 2026, with a June-quarter record: $109.4 billion in revenue, $29.8 billion in net income, and approximately $29.8 billion returned to shareholders in a single quarter. Behind those numbers sits a capital-allocation machine that has spent more money buying back its own shares than any other company in U.S. history — and a question investors have rarely needed to ask: does the math still work?
Part A — Q3 FY2026 Results
Revenue by Segment
| Segment | Q3 FY2026 | YoY Change |
|---|---|---|
| iPhone | $54.3B | +22% |
| Services | $30.7B | +12% |
| Mac | $10.4B | +29% |
| Wearables, Home & Accessories | $7.9B | +6% |
| iPad | $6.2B | -6% |
Segment figures sum to ~$109.5B; Apple reports total revenue of $109.4B due to rounding. Geographic breakdown available in the 10-Q.
iPhone, Mac, and Services all set June-quarter records. iPad was the lone decliner; Apple's tablets typically carry longer replacement cycles than phones, weighing on mid-cycle quarters.
Gross margin reached 50.1%, but approximately two percentage points reflected a non-recurring tariff refund under IEEPA-related litigation. Diluted EPS came in at $2.02, up 29% year-over-year (on approximately 14.75 billion diluted shares); Apple noted that roughly $0.12 per share of the EPS improvement traced to the tariff benefit.
For the September quarter (fiscal Q4 FY2026), Apple guided revenue growth of 9–11% and gross margin of 47–48%, including roughly one percentage point of remaining tariff tailwind.
Capital Returned in Q3
Apple returned approximately $29.8 billion to shareholders in the June quarter: $25.8 billion through share repurchases and approximately $4.0 billion in dividends ($0.27 per share × ~14.75 billion diluted shares ≈ $3.98B, rounded). Through the first nine months of fiscal 2026, repurchases totaled $62.1 billion and dividends $11.8 billion, for a combined $73.9 billion.
At the nine-month average buyback pace of approximately $20.7 billion per quarter, Apple's full-year FY2026 repurchase total is tracking toward approximately $83 billion — below the $100 billion authorization Apple's board approved alongside Q2 FY2026 results in April 2026. The authorization represents a ceiling, not a target.
Part B — The Buyback Math at a Crossroads
Fifteen Years, $877 Billion
When Tim Cook became CEO in August 2011, Apple's diluted shares outstanding stood at approximately 26 billion (adjusted for all subsequent stock splits). As of Q3 FY2026, that figure stood at approximately 14.75 billion — a reduction of approximately 43%. Cook's tenure oversaw approximately $877 billion in cumulative stock repurchases, a figure with no precedent in corporate history.
The arithmetic effect on long-term shareholders is concrete. An investor who held 1% of Apple in 2011 now holds an effective stake of approximately 1.76% — without purchasing a single additional share (26B / 14.75B ≈ 1.76×). Buybacks act as a compounding EPS lever: a company that grows net income 10% annually while retiring 3% of its diluted shares each year delivers roughly 13% EPS growth.
How Share Price Changes the Efficiency Equation
Each dollar of a buyback program retires a number of shares equal to one dollar divided by the current share price. The percentage of diluted shares outstanding that this represents depends on two variables: the share price and the total diluted count. As the share price rises, the percentage retired per dollar falls; as the diluted count declines, the denominator shrinks, which partially offsets the effect of higher prices.
A direct comparison shows the net result:
2012–2014: Apple's split-adjusted share price ranged roughly $15–$18. During that window, diluted shares outstanding ranged approximately 24.5–26.5 billion (FY2012: ~26.5B, FY2013: ~26.1B, FY2014: ~24.5B, adjusted for the 28× cumulative split). At a midpoint of ~$16.50 and ~25.5 billion diluted shares, $10 billion retired approximately 606 million shares — about 2.4% of diluted shares outstanding.
August 2026: Apple's share price is approximately $235. $10 billion retires approximately 42.6 million shares out of ~14.75 billion diluted shares outstanding — about 0.29%.
The percentage of diluted shares retired per $10 billion has declined approximately 8-fold over more than 12 years (2.4% ÷ 0.29% ≈ 8.3×). The dominant driver is the roughly 14-fold increase in Apple's split-adjusted share price (from ~$16.50 to ~$235). The substantially smaller diluted count (14.75B vs. ~25.5B midpoint) partially offsets by shrinking the denominator, but not enough to neutralize the price effect. (14.24× price increase ÷ 1.73× count reduction ≈ 8.2× net efficiency decline.)
In net: each dollar still increases remaining shareholders' proportional stakes. The mechanism is unchanged. But the magnitude of that concentration effect per dollar deployed has narrowed substantially from the program's early years.
The $100B Authorization in Context
Apple's board authorized $100 billion in share repurchases alongside Q2 FY2026 results in April 2026 — the second consecutive year at that level, after the record $110 billion program announced in May 2024. The authorization is supported by Apple's operating cash flow, which substantially exceeds its capital expenditure needs; Apple has maintained a net cash position for most of the Cook era.
The core strategic question is not whether Apple can sustain the buyback program. The question is whether allocating $80–100 billion per year to repurchases — at a share price that makes each dollar's concentration effect roughly 8-fold smaller than it was in the program's early years — remains the highest-return use of that capital.
What Ternus May Change
John Ternus, who became Apple's SVP of Hardware Engineering in January 2021, takes over as CEO on September 1, 2026, with Cook moving to Executive Chairman.
Ternus is an engineering executive — the internal face of the M-series chip transition, Vision Pro, and Apple's accelerating silicon strategy. The market's implicit question is whether a product-oriented CEO might redirect capital from repurchases toward R&D or strategic acquisitions, particularly as Apple navigates increasing competition in AI-integrated hardware and services.
Apple has not signaled any change in capital allocation policy, and Cook-era board members retain control over authorization decisions. But history suggests that CEO transitions at large, capital-allocation-driven companies often produce at least a strategic recalibration within two to three fiscal years.
Three Metrics to Watch
- Q4 FY2026 (September quarter) actual buybacks vs. Q3's $25.8B: Does the pace hold, or decelerate as the CEO transition finalizes?
- FY2027 authorization size (typically announced alongside Q2 FY2027 results, April or May 2027): Will it remain at $100B, increase, or shift toward other uses?
- R&D and CapEx trajectory under Ternus: If hardware spending accelerates materially, the tradeoff with buyback volume will appear in the cash flow statement within one to two quarters.
This article is for informational purposes only and does not constitute investment advice. All financial figures are derived from Apple's SEC filings and publicly available earnings disclosures.
Sources - Apple Q3 FY2026 Press Release (Apple Newsroom) - Apple Q3 FY2026 8-K (SEC EDGAR) - Apple's $100 Billion Buyback Machine — 24/7 Wall St. - Tim Cook's Final Earnings Call as CEO — Yahoo Finance - Tim Cook Handing Off Apple to John Ternus — The Motley Fool