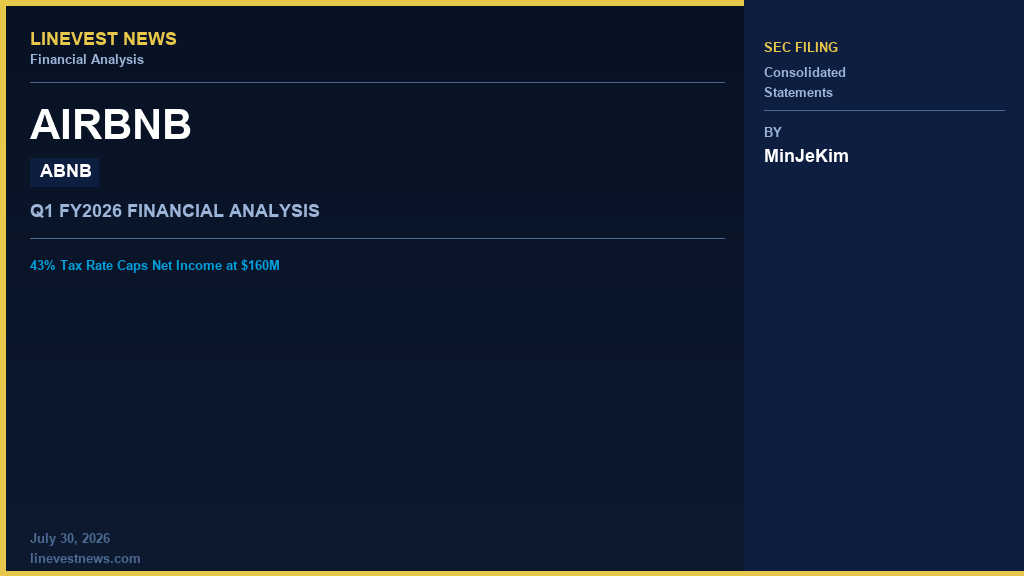
에어비앤비 (ABNB) 2026년 1분기: 43% 세율로 순이익 1억 6,000만 달러에 그쳐
에어비앤비의 2026년 1분기 영업이익은 두 배 이상 증가해 8,600만 달러를 기록했으나, 순이익은 600만 달러 증가에 그쳤다. 미국 법인 대체최소세(CAMT) 적용에 따른 일회성 이연법인세자산 상각(6,900만 달러)으로 실효세율이 11.0%에서 43.1%로 급등했기 때문이다. 해당 상각분과 이를 상쇄하는 지분투자 매각 차익(7,000만 달러)을 제외한 정상화 순이익은 1억 5,900만 달러로, 전년 동기 대비 사실상 보합 수준이다. 실질적으로 주목해야 할 지표는 손익계산서 하단에 있다. 매출 대비 비용 비중을 보면, 에어비앤비가 해외 성장에 투자하면서 3.3%포인트 확대된 영업·마케팅비를 제외한 모든 비용 항목이 개선됐다. 매출은 17.9% 증가한 26억 7,800만 달러를 기록했으며, 숙박 및 좌석 예약 건수는 9.1% 늘어 1억 5,600만 건을 달성했다. 이는 매출 성장의 약 51%가 거래량 증가에서, 나머지 49%는 평균 일일 요금 상승 및 믹스 변화에서 비롯됐음을 의미한다.
1. 연결 재무상태표
1-1. 주요 자산 변동
| 항목 | 2025년 12월 31일 (백만 달러) | 2026년 3월 31일 (백만 달러) | 변동률 |
|---|---|---|---|
| 현금 및 현금성자산 | 6,560 | 7,037 | +7.3% |
| 단기투자 | 4,454 | 4,968 | +11.5% |
| 미수금 / 고객 대리 보관 자금 | 6,959 | 10,550 | +51.6% |
| 선급비용 및 기타 유동자산 | 824 | 1,046 | +26.9% |
| 이연법인세자산 | 2,102 | 1,941 | -7.7% |
| 영업권 및 무형자산(순액) | 770 | 767 | -0.4% |
| 자산 총계 | 22,208 | 26,828 | +20.8% |
재무상태표가 20.8% 팽창한 것은 대부분 회계적 착시 효과다. 미수금 및 고객 대리 보관 자금(105억 5,000만 달러)은 고객 지급 미지급금(105억 5,000만 달러)과 1대 1로 대응된다. 이는 게스트가 지급한 대금이 호스트에게 전달되는 과정에서 일시적으로 보유하는 자금으로, 에어비앤비의 자기 자본이 아니다. 이 수탁 자금을 제외하면 자산 총계는 152억 4,900만 달러에서 162억 7,800만 달러로 증가해, 실제 증가율은 6.7%에 불과하다.
에어비앤비는 재고자산을 보유하지 않으며, 재무상태표에 별도의 유형자산 항목도 없다. 268억 달러 규모의 자산 중 영업권 및 무형자산이 7억 6,700만 달러에 불과하다는 사실은 플랫폼 비즈니스 모델의 경자산(asset-light) 특성이 여전히 유지되고 있음을 방증한다. 이연법인세자산의 1억 6,100만 달러 감소는 아래에서 설명할 CAMT 조정의 재무상태표상 흔적으로, 현금 유출이 아닌 재무상태표 자산의 비현금 소멸에 해당한다.
부채 만기 구조는 이번 분기에 전면 재편됐다. 에어비앤비는 2026년 3월 16일 총 25억 달러 규모의 선순위 무담보채권을 3개 트랜치로 발행했다. 구체적으로는 ▲2029년 만기 4.40% 채권 8억 5,000만 달러 ▲2031년 만기 4.65% 채권 8억 5,000만 달러 ▲2036년 만기 5.25% 채권 8억 달러로 구성되며, 가중평균 쿠폰금리는 4.76%, 유효이자율 기준으로는 4.99%다. 원금의 약 68%에 해당하는 약 17억 달러는 5년 이내에 만기가 도래하며, 나머지 8억 달러는 그 이후에 만기가 돌아온다. 에어비앤비는 17억 달러 명목 금액의 금리스왑 계약을 통해 2031년 및 2036년 만기 트랜치를 변동금리(SOFR)로 전환했으며, 이에 따라 신규 발행 채권의 3분의 2가 단기금리 변동에 노출된 상태다.
1-2. 부채 구조 — 금융 부채 대 영업 부채
| 항목 | 2025년 12월 31일 ($M) | 2026년 3월 31일 ($M) |
|---|---|---|
| 장기부채 유동 대체액 | 1,999 | — |
| 장기부채, 순액 | — | 2,475 |
| 금융 부채 소계 | 1,999 | 2,475 |
| 고객 예치금 미지급금 (수탁) | 6,959 | 10,550 |
| 선수수수료 | 1,743 | 2,733 |
| 미지급비용, 매입채무 및 기타 | 2,948 | 3,081 |
| 기타 비유동 부채 | 360 | 353 |
| 부채 총계 | 14,009 | 19,192 |
총 금융 부채는 $476 million 증가에 그쳤으나, 그 성격은 완전히 바뀌었다. 상환된 $2.0 billion 규모의 채권은 0% 전환사채였으나, 이를 대체한 채권은 연간 약 $119 million의 현금 쿠폰을 부담한다. 공시에 따르면 1분기 이자 비용은 중요하지 않았는데, 해당 채권이 단 15일간만 발행 상태에 있었기 때문이다. 따라서 분기당 약 $30 million의 이자 비용이 보고된 수치보다 앞으로 추가 발생할 예정이다. 분기 이자 수익 $155 million($173 million 대비 10.4% 감소)과 비교할 때, 순이자 항목은 양방향에서 축소 압박을 받을 전망이다.
영업 부채는 수요 동향을 그대로 보여준다. 선수수수료는 56.8% 증가한 $2,733 million을 기록하며 여름 시즌 선예약을 반영했다. 미지급비용 내 간접세 및 숙박세·원천징수세 추정 부채는 $1,132 million에서 $1,501 million으로 32.6% 상승해 매출 성장률을 상회했으며, 제4절의 우발채무와 함께 지속적인 모니터링이 필요하다.
1-3. 자본 구조
주주지분 합계는 회사가 $160 million의 순이익을 달성했음에도 6.9% 감소한 $7,636 million을 기록했다. 변동 내역은 명확하다: 기초 자본 $8,199 million에 순이익 $160 million, 기타포괄손익 $60 million, 주식보상비용 $410 million을 더하고, 임직원 세금 납부를 위해 환수한 자사주 $132 million과 자사주 매입 $1,061 million을 차감하면 정확히 $7,636 million이 된다.
납입자본 $14,041 million과 누적결손금 $6,403 million의 구도는 최근에야 지속적인 흑자 기조에 진입해 이제 공격적으로 자본을 주주에게 환원하고 있는 기업의 전형적인 특징이다. 결손금은 단 한 분기 만에 $901 million 확대됐는데, 자사주 매입이 이에 직접 차감되기 때문이다. 이는 자본 기반의 의도적인 축소이지 악화가 아니다: 수탁 자금을 제외한 자기자본비율은 46.9%이며, 회사는 $2,475 million의 부채 대비 $12,005 million의 현금 및 단기투자자산을 보유해 연말 $9,015 million에서 개선된 순현금 포지션 $9,530 million을 유지하고 있다.
2. 연결 손익계산서
2-1. 핵심 수익성, 3개년 1분기 비교
| 항목 | Q1 2024 ($M) | Q1 2025 ($M) | Q1 2026 ($M) | 2Y CAGR |
|---|---|---|---|---|
| 매출 | 2,142 | 2,272 | 2,678 | +11.8% |
| 영업이익 | 101 | 38 | 86 | -7.7% |
| 영업이익률 (%) | 4.71 | 1.67 | 3.21 | — |
| 당기순이익 | 264 | 154 | 160 | -22.2% |
| 순이익률 (%) | 12.32 | 6.78 | 5.97 | — |
Q1 2024 및 Q1 2025 수치는 SEC XBRL 기업 개념 데이터와 대조 검증; Q1 2026은 공시 원문 기준.
표면적인 회복은 실재하지만 불완전하다. 영업이익 $86 million은 전년 대비 126.3% 증가했으나, 20% 적은 매출로 에어비앤비가 Q1 2024에 달성한 $101 million에는 여전히 미치지 못한다. 2년간 매출은 연 11.8%로 성장한 반면 영업이익은 연 7.7% 축소됐는데, 이는 다년간에 걸쳐 외형 성장이 마진 확대보다는 시장점유율 확대로 전환되고 있음을 보여주는 구도다.
해당 분기의 영업 레버리지는 극단적인 수준을 보였다. 매출이 17.9% 증가하는 동안 영업이익은 126.3% 급증해 약 7.1배의 배율을 기록했으나, 이는 출발점인 1.67%의 낮은 이익률에서 비롯된 수치일 뿐 구조적 레버리지의 증거는 아니다. 영업이익선 아래에서는 제3자에게 매각된 비상장 주식 투자에서 발생한 $7,000만 실현 이익에 힘입어 세전이익이 62.4% 증가한 $2억 8,100만에 달했다. 실제 납부한 현금세액 $4,000만에 크게 못 미치는 $1억 2,100만의 법인세 비용에는 CAMT에서 비롯된 $6,900만의 이연법인세자산 조정과 주식보상 세액공제 축소분이 포함된다. 지분 매각 이익을 제외하면 세전이익은 $2억 1,100만(+22.0%)이며, CAMT 부담을 제외하면 법인세 비용은 $5,200만으로 실효세율 24.6%, 정규화 순이익은 $1억 5,900만이다.
희석 주당순이익(EPS)은 8.3% 상승한 $0.26을 기록한 반면 순이익은 3.9% 증가하는 데 그쳤다. 이 괴리는 자사주 매입에서 비롯된다. 희석 주식 수가 6억 3,200만 주에서 6억 800만 주로 3.8% 감소하며 EPS 증가분의 약 3.9%포인트를 기여했다. 에어비앤비는 클래스 A 주식 810만 주를 평균 약 $134에 총 $10억 8,800만에 자사주 매입했으며, 잔여 매입 한도는 $45억이다.
2-2. 고정비 대 변동비 행태
공시 보고서의 부문 주석은 비용을 성격별로 분류해 공시하고 있으며, 이를 통해 재량적 지출 결정과 그 외 항목을 구분할 수 있다.
| 비용(성격별) | Q1 2025 ($M) | Q1 2026 ($M) | 증감률 |
|---|---|---|---|
| 가맹점 수수료 및 차지백 | 399 | 474 | +18.8% |
| 급여 및 복리후생 | 507 | 587 | +15.8% |
| 마케팅 | 382 | 506 | +32.5% |
| 주식보상 | 358 | 410 | +14.5% |
| 전문직 및 외부 서비스 | 260 | 282 | +8.5% |
| 비소득세 | 57 | 48 | -15.8% |
| 기타 항목 | 271 | 285 | +5.2% |
| 비용 합계 | 2,234 | 2,592 | +16.0% |
실질적인 변동비 항목인 가맹점 수수료는 18.8% 증가해 총 예약 금액 증가율 19.1%와 거의 정확히 일치했다. 급여, 주식보상, 전문직 서비스, 기타 항목으로 구성된 대체로 고정적인 비용군은 12.0% 증가에 그쳐 매출 증가율 17.9%를 편안하게 밑돌았다. 이것이 진정한 레버리지다.
마케팅은 경영진이 자원을 투입하기로 선택한 영역이다. 손익계산서상 영업 및 마케팅 비용은 33.4% 증가한 $7억 5,100만으로, 매출 대비 비중이 24.8%에서 28.0%로 상승했다. 다른 모든 비용 항목은 개선됐다. 매출원가는 0.58%포인트 하락한 매출의 21.7%, 운영 및 지원 비용은 1.16%포인트, 제품 개발 비용은 1.18%포인트, 일반 및 관리 비용은 1.89%포인트 하락한 11.1%를 기록했다. 영업 및 마케팅 비용이 전년도 매출 대비 비율을 유지했다면 영업이익은 $8,600만이 아닌 약 $1억 7,300만에 달했을 것이다. 이익률 부진 전체가 단 하나의 의도적인 항목에서 비롯된다.
비교 가능성에 관한 구조적 참고 사항: 회사는 내부 개발 소프트웨어 자본화에 관한 ASU 2025-06을 2026년 1월 1일부터 전진 방식으로 조기 채택했으며, 채택 시점의 영향은 없었고 2026년 전체에 대한 영향도 없을 것으로 예상된다. 따라서 이번 분기에는 제품 개발 비용 항목의 전기 대비 비교 가능성에 영향이 없다.
3. 연결 현금흐름표
| 항목 | Q1 2025 ($M) | Q1 2026 ($M) | 변동 |
|---|---|---|---|
| 영업활동 순현금 | 1,789 | 1,708 | -4.5% |
| 투자활동 사용 순현금 | (151) | (461) | — |
| 재무활동 순현금 | 2,145 | 2,970 | +38.5% |
| 환율 변동 효과 | 207 | (118) | — |
| 기말 현금, 현금성자산 및 제한 현금 | 16,750 | 17,585 | +5.0% |
현금, 현금성자산 및 제한 현금은 분기 말 기준 $175억 8,500만으로, 2025년 말 $134억 8,600만 대비 $40억 9,900만 증가했다.
에어비앤비는 고정자산을 거의 보유하지 않기 때문에 잉여현금흐름은 사실상 영업현금흐름과 동일하다 — 회사는 이번 분기 양쪽 모두 $1.7 billion을 기록했으며, 전년 동기는 $1.8 billion이었다고 밝혔다. 그러나 마진은 급격히 악화됐다: 잉여현금흐름이 매출의 63.8%에 해당해, 2025년 1분기의 78.7%에서 하락했다.
원인은 이익보다 운전자본에 있다. 미수수수료 증가분이 영업현금흐름에 기여한 금액은 $988 million으로, 총 예약금액(GBV)이 19.1% 증가했음에도 불구하고 전년 동기 $1,105 million에서 감소했다. 경영진은 리드타임 장기화의 원인 중 하나로 후불 결제 프로그램 확대를 꼽는다 — 지금 예약하고 나중에 결제하는 고객은 예약은 발생시키지만 선불 현금은 제공하지 않는다. 거래량이 늘어도 선수금 수취는 줄어드는 현상이 바로 이연수수료 증가분 축소로 나타나며, 이는 다음 분기에 가장 중점적으로 추적해야 할 단일 지표다.
보고된 이익의 질은 영업현금흐름 대비 순이익 비율 10.7x로 인상적으로 보이지만, 이 비율은 부동자금과 비현금 가산항목이 주도한 결과다. 미수수수료 증가분과 주식보상비용을 제거하면 실질 현금이익은 약 $310 million으로, 전년 동기 동일 기준 $326 million에서 보합 내지 소폭 감소한 수준이다 — 정상화 순이익 수치와도 일치하는 흐름이다.
재무활동은 대차대조표와 동일한 수탁계정 조정이 필요하다. $2,970 million의 현금 유입 중 $3,707 million은 단순히 고객에게 지급해야 할 자금의 증가분이다. 이를 제외하면 에어비앤비는 자본을 순반환한 셈이다: $2,483 million의 차입금 조달에서 $2,000 million의 원금 상환, $1,088 million의 자사주 매입, $140 million의 주식보상세금을 차감하고 $8 million의 스톡옵션 행사를 더한 결과 — 순유출 $737 million으로, 전년 동기 $929 million에서 감소했다. 이는 $483 million의 순 신규 장기부채가 자사주 매입 증가분을 상쇄하고도 남은 결과다.
이 기사는 정보 제공 및 저널리즘 목적으로만 작성되었으며, 투자 조언 또는 특정 증권의 매수·매도 권유가 아닙니다. LineVest News는 독립 출판물로, 등록된 투자자문업자가 아닙니다. 모든 데이터는 2026년 3월 31일 종료 분기에 대해 미국 증권거래위원회(SEC)에 제출된 에어비앤비의 Form 10-Q를 출처로 합니다.