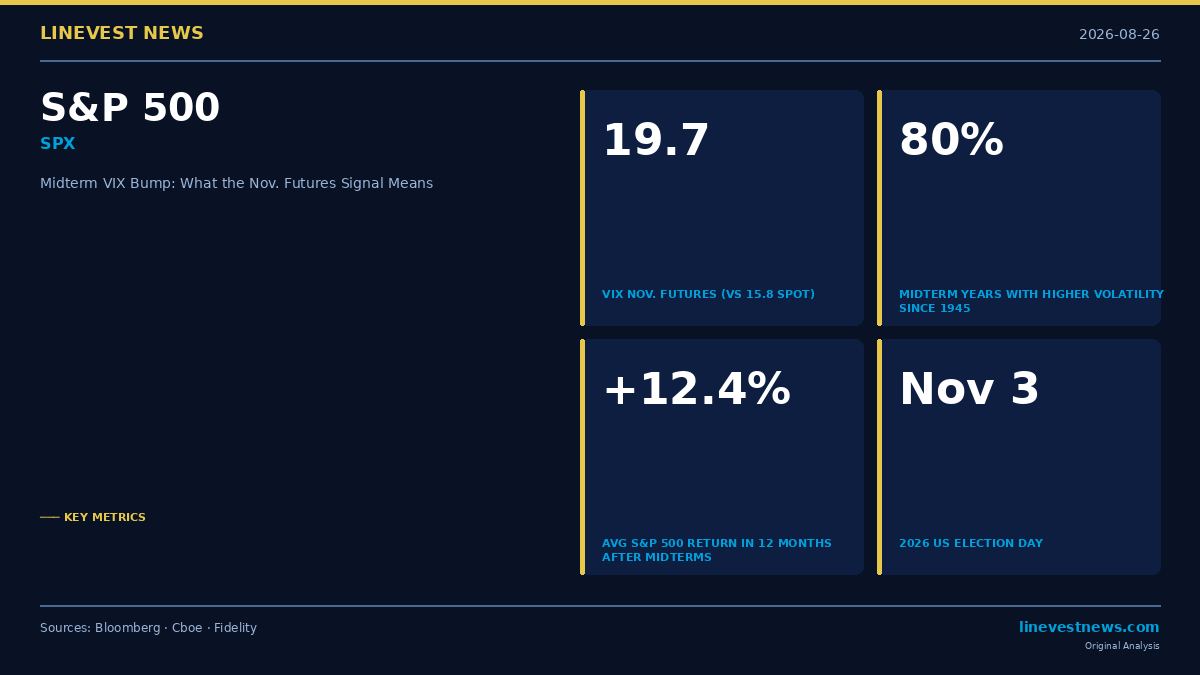
TL;DR - The VIX spot is a calm 15.8, but November futures have jumped to 19.7 — a clear midterm hedge signal - Since 1945, realized volatility exceeded the prior year in 80% of midterm election cycles - Historically the S&P 500 averages only ~4% in midterm years, then rebounds ~12.4% in the following 12 months - Election Day is November 3, 2026; a split Congress is the base-case scenario in current polling - Cheap vol today may not last — options dealers warn the window to hedge affordably is narrowing
Part A — The Signal: One Bump in the Futures Curve
On August 25, 2026, volatility traders spotted something in the VIX futures term structure: a staircase pattern building steadily toward Election Day.
| Contract | Level |
|---|---|
| Spot VIX (Aug 25) | 15.8 |
| September 2026 futures | 17.4 |
| October 2026 futures | 19.0 |
| November 2026 futures | 19.7 |
Note: Long-term VIX average is 19.4 (not a futures contract; shown for reference). Source: Cboe, as reported by Bloomberg, August 25, 2026.
The current spot reading of 15.8 is well below the 19.4 long-term VIX mean, but futures tell a different story. November contracts are pricing in volatility roughly equal to the historical average — a full 3.9 points above where the spot index sits today.
"You can already see a clear steepening in the VIX futures term structure," Matthew Thompson of Little Harbor Advisors told Bloomberg. "Traders are pricing uncertainty as it approaches the election."
Mandy Xu, head of derivatives market intelligence at Cboe, noted that newly listed election-specific contracts will attract "a growing number of election-specific trades" as November nears. The exchange now offers single-day VIX options expiring on Election Day itself, and the S&P 500's implied single-day move on Election Day (November 3) is approximately 1.4% — modest by historical standards, but meaningful for an index trading near all-time highs.
Brent Kochuba of SpotGamma put it plainly: "Insurance is very cheap right now. If you hold stocks and need to hedge, this is the time to buy options."
Where Stocks Stand Going In
The S&P 500 reached an all-time high of 7,816.70 on August 13, 2026, and is up roughly 12.7% year-to-date through late August — well above the historical midterm-year average of around 4%. As of August 25, the index sits approximately 1.6% below that record. The March 2026 peak-to-trough decline was only 9%, short of the historical average midterm intra-year drawdown of approximately 19% observed since 1962.
In short: the S&P is outperforming the historical midterm script, volatility is subdued, but options markets are beginning to price in the premium that typically arrives as November approaches.
Part B — What History Says, and What It Means for Investors
The Historical Record
The pattern around U.S. midterm elections is one of the most robust in market history. Cboe data going back to 1945 show that realized stock-market volatility exceeded the prior year's level in 80% of midterm election cycles. When the same party controls both chambers of Congress and the White House — the current configuration under a Republican trifecta — the average volatility increase reaches 6 percentage points.
For returns, the midterm year is typically the weakest leg of the four-year presidential cycle:
| Period | S&P 500 Avg. Return | Win Rate |
|---|---|---|
| Midterm election year | ~4% (median ~1%) | ~65% |
| All years (1945–2025) | ~10.9% | ~75% |
| 12 months after midterms | ~12.4% | ~95% |
| 3 months after midterms (since 1970) | ~6.5% | ~90% |
Sources: Cboe, Hartford Funds, Capital Group, Fidelity.
The 95% positive-return rate in the 12 months following a midterm election — across 22 midterm cycles since 1938 — is one of the strongest recurring signals in U.S. market history. It has held in 21 of those 22 cycles regardless of which party won. The mechanism is well-understood: policy uncertainty compresses after the ballot is counted, and markets recalibrate to whatever the new balance of power produces — regardless of its partisan character.
The 2026 Political Landscape
Understanding the investment read-through requires clarity on what is actually being contested:
- Election Day: November 3, 2026
- All 435 House seats are up for election
- 35 Senate seats are contested: 33 regular Class II seats plus two special elections (Republicans defend 20 of the 33 regular seats)
- Republicans currently hold a 53–47 majority; they can afford a net loss of two seats and still hold 51 outright
- Democrats need a net gain of four seats (from 47 to 51) to win the chamber outright
Current generic ballot polling shows Democrats leading by roughly 14 percentage points (55% vs. 41%) among registered voters nationally, per Reuters/Ipsos. However, Senate seat geography — where Republicans are defending heavily red-state seats — creates a structural mismatch between national polling and Senate outcomes.
Base-case scenario: a split Congress — Democrats flipping the House while Republicans retain the Senate. Historical data suggest a split Congress is, counterintuitively, the outcome markets have most frequently followed with strong rallies: gridlock limits dramatic policy shifts, which investors tend to price positively.
Bank of America's Tail Risk
Not every outcome is benign. A Bank of America analysis flagged one scenario where equity markets could face a 10%+ drawdown: a Democratic sweep that captures the Senate alongside major governorships (including Texas). That outcome would open the legislative path for potential tax-code revisions, including corporate rate increases and capital-gains restructuring that have historically weighed on equity valuations.
The probability assigned to this scenario in prediction markets remains low — but the asymmetry is worth noting: the upside from a split-Congress base case may be smaller than the downside from a blue-sweep tail scenario.
The Investor Playbook: Three Scenarios
Scenario A — Republican trifecta survives (Republicans hold both chambers) Historically the least market-disruptive outcome in the short term. Tax policy continuity; current tariff framework persists. The VIX November premium deflates quickly post-election. Likely a classic post-midterm rally setup entering 2027.
Scenario B — Split Congress (base case) Legislative gridlock; executive action remains the primary policy channel. Historically the scenario most reliably associated with the post-midterm rally pattern. Near-term, Fed policy (FOMC's September 15–16 meeting comes first) dominates the narrative. Markets tend to price gridlock as stability.
Scenario C — Democratic sweep Low probability per current polling; highest market risk. Reintroduction of legislative proposals on corporate taxes, capital gains rates, and potential new healthcare spending could weigh on earnings expectations. The BofA 10%-plus downside estimate applies most directly here.
Five Tactical Considerations
The hedge window is open — but closing. At 15.8, spot VIX is approximately 3.6 points below its long-term average. Options expiring in November are priced near fair historical value, but the current spread between spot and November futures (3.9 points) will compress sharply if volatility accelerates. Investors with concentrated equity exposure who want downside protection should evaluate their timeline before September.
The typical midterm drawdown hasn't arrived. The March 2026 pullback was 9%, against a historical average midterm intra-year drawdown of ~19% since 1962. A larger correction before November is a non-trivial scenario — not a prediction, but a historical base rate worth incorporating in scenario planning.
September FOMC (September 15–16) is an independent catalyst. Any hawkish signal from the Fed could compress equity multiples independently of election outcomes. The two events — FOMC and election — create a layered uncertainty calendar for Q3/Q4.
Post-midterm positioning has historically rewarded early movers. The ~6.5% average three-month post-election gain since 1970 tends to begin in the immediate days following the result. Waiting for "certainty" often means missing the first leg of the rally.
Gridlock is not neutral — it is bullish, historically. Since the 1950s, split-Congress configurations have produced some of the strongest market years on record. Investors who conflate "political risk" with "bearish for equities" misread the historical relationship.
Bottom Line
The VIX November bump is not a fire alarm. It is a smoke detector — an early signal that professional traders are beginning to price in the event risk that has historically arrived in the weeks before a midterm. The current spot VIX of 15.8 makes protection comparatively cheap. Across 22 cycles since 1938, the 12 months following a midterm election have been positive 95% of the time — a pattern that has held regardless of which party won.
The investment question is not who wins November 3. It is how much uncertainty is priced in before that date, and how quickly it deflates after.
Sources - Bloomberg, "VIX Curve 'Bump' Shows Stock-Market Anxiety Growing by Midterms," Aug 25, 2026 - Cboe Global Markets, VIX futures term structure data - Fidelity, "The Surprising Truth About Midterms and Stocks" - Capital Group, "How U.S. Midterm Elections May Affect Markets" - Hartford Funds, S&P 500 midterm cycle analysis - Bank of America, 2026 midterm scenario analysis - Reuters/Ipsos, Generic congressional ballot poll, August 2026 - Ballotpedia, United States Congress elections, 2026 - Advisor Perspectives, S&P 500 Snapshot, August 21, 2026
Disclaimer: This article is for informational purposes only and does not constitute investment advice. LineVest News is not a registered investment adviser. All data cited are sourced from publicly available reports and subject to revision. Past market performance is not indicative of future results.