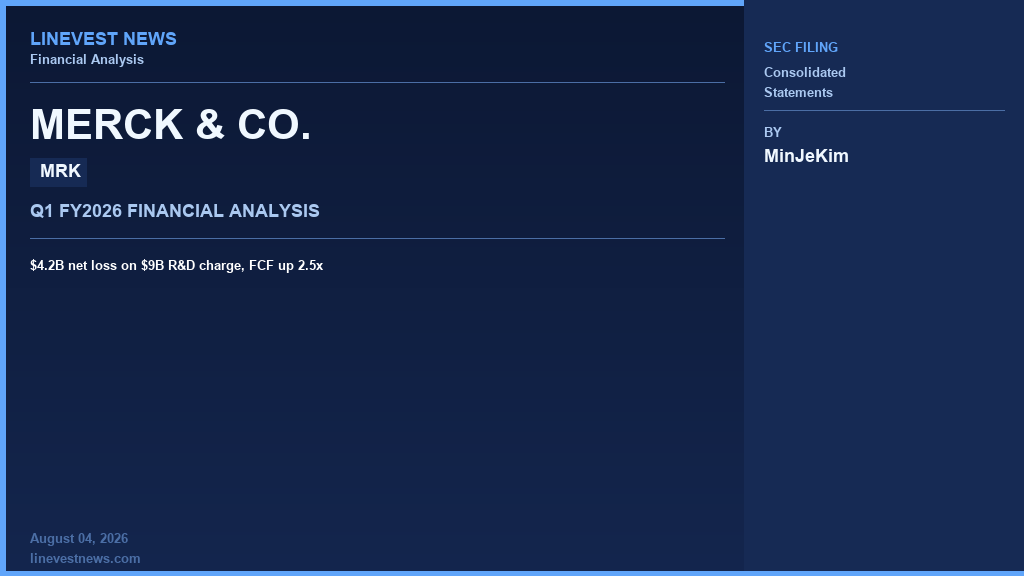
Merck & Co. (MRK) Q1 2026: $4.2B net loss on $9B R&D charge, FCF up 2.5x
Merck & Co., Inc. (NYSE: MRK) reported earnings on April 30, 2026, and the Q1 2026 10-Q filed shortly after looks, at first glance, like a catastrophe. Revenue of $16.29 billion grew 4.9% from $15.53 billion a year earlier, yet net income swung from a $5.09 billion profit to a $4.24 billion net loss. On a per-share basis, the result moved from +$2.01 to -$1.72. The source of the loss is unambiguous: Merck immediately expensed $9.0 billion ($3.62 per share) as R&D costs when it accounted for the January acquisition of Cidara Therapeutics — valued at $9.2 billion — as an asset acquisition rather than a business combination. The cash balance fell 63.4% in three months, from $14.57 billion to $5.33 billion, while the March announcement of a $6.7 billion acquisition of Terns Pharmaceuticals (expected to close in May, with an additional $5.8 billion R&D charge on deck) compounds the pipeline overhaul that is reshaping Merck's financial statements.
Note on currency translation: All Korean-won figures cited in this document apply the March 31, 2026 closing rate of $1 = approximately KRW 1,537 (exchange-rates.org), the highest level of the year. Given the weak-won environment in 2026, translated amounts vary materially with exchange rate assumptions; dollar figures should be treated as the primary reference.
1. Consolidated Balance Sheet Analysis
1-1. Key Asset Comparison
| Item | Dec 31, 2025 ($B) | Mar 31, 2026 ($B) | Change | Interpretation |
|---|---|---|---|---|
| Cash and cash equivalents | 14.565 | 5.327 | -63.4% | $8.779B Cidara acquisition payment was the decisive outflow |
| Accounts receivable (net) | 11.775 | 12.210 | +3.7% | In line with 4.9% revenue growth; allowance edged up from $0.097B to $0.103B |
| Inventories (current) | 6.658 | 6.479 | -2.7% | Non-current inventory rose from $5.681B to $6.195B — long-dated raw material and antibody stockpiling |
| PP&E (net) | 25.316 | 25.433 | +0.5% | Accumulated depreciation moved from $21.914B to $22.288B; net increase minimal |
| Intangible assets (net) | 26.681 | 25.745 | -3.5% | Amortization of existing licenses including Keytruda, Lynparza, and Lenvima |
Key implication: Total assets fell from $136.866 billion to $128.685 billion, a 6.0% decline. Most of the reduction came from cash outflows. The more striking accounting point is that of the $9.2 billion paid for Cidara, only $332 million was recorded as net assets on the balance sheet. The remaining $9.0 billion was expensed directly as "acquired in-process research and development with no alternative future use," leaving no trace on the balance sheet. Note that the $9.2 billion includes $570 million in share-based compensation settlements (of which $406 million was unvested), so acquisition cost, the expensed charge, and net assets recognized do not reconcile exactly.
This is standard GAAP treatment when substantially all of the fair value of acquired assets is concentrated in a single asset (MK-1406), triggering asset acquisition rather than business combination classification — but the income-statement impact is severe in the near term.
1-2. Liability Structure — Financial Debt vs. Operating Liabilities
Financial debt - Short-term borrowings + current portion of long-term debt: $2.589B → $2.444B (-5.6%) - Long-term debt: $46.750B → $46.673B (-0.2%) - Total financial debt: $49.339B → $49.117B (essentially unchanged)
Operating liabilities - Accounts payable: $4.404B → $3.863B (-12.3%) - Accruals and other current liabilities: $14.468B → $14.549B (+0.6%) - Income taxes payable: $4.726B → $3.946B (-16.5%) — signals substantial tax payments in Q1 - Deferred income taxes: $1.439B → $1.494B (+3.8%)
Hedging scope is narrower than it appears: Interest rate swaps cover only a portion of long-term debt. As of March 31, Merck had 10 pay-floating/receive-fixed swaps in place, hedging fixed-rate notes including the 4.50% 2033 notes ($1.5B face), the 4.75% 2035 notes ($1.5B face), and the 5.00% 2053 notes ($1.5B face), with a total hedged face value of $4.5 billion and total swap notional of $2.5 billion (fair-value hedges tied to SOFR). That means roughly 10% of the $46.7 billion long-term debt portfolio carries hedge coverage; the remainder is exposed to fair-value fluctuations in fixed-rate form. Two additional forward starting swaps at $250 million notional each (total $500 million) were entered into in February 2026.
Cidara was funded from cash on hand, but Terns will require external debt. In April 2026, Merck executed a 364-day delayed draw term loan of up to $6.0 billion (SOFR+0.50%, stepping up to SOFR+0.75% 180 days after draw) and has already issued full-draw notices. This facility will fund a portion of the $6.7 billion acquisition; the remainder comes from internal cash. Merck plans to refinance the term loan through long-term bond issuance — debt expansion is confirmed, not hypothetical.
1-3. Equity Structure
- Common stock + additional paid-in capital: $1.788B + $45.029B → $1.788B + $45.176B (roughly flat)
- Retained earnings: $73.075B → $66.721B (-8.7%)
- Treasury stock (at cost): $62.999B → $63.747B (+1.2%; $874M purchased in Q1)
- Total equity: $52.606B → $45.878B (-12.8%)
Shareholders' equity contracted by $6.7 billion in three months. The retained earnings decline of $6.35 billion is explained exactly by the $4.24 billion net loss plus $2.11 billion in dividends, with $874 million in share repurchases adding further pressure through the capital adjustment line. Accumulated retained earnings of $66.7 billion nonetheless leave capital fundamentals intact.
2. Consolidated Income Statement Analysis
2-1. Key Profitability Metrics
| Item | Q1 2025 ($B) | Q1 2026 ($B) | Change |
|---|---|---|---|
| Revenue | 15.529 | 16.286 | +4.9% |
| Net income (loss) | 5.085 | -4.243 | Swung to loss |
| EPS (GAAP, $) | +2.01 | -1.72 | Swung to loss |
| Acquired IPR&D charge | 0 | 9.000 | New |
| Depreciation | 0.502 | 0.581 | +15.7% |
| Amortization of intangibles | 0.597 | 0.931 | +55.9% |
In-depth analysis: - The 4.9% revenue gain was driven by Keytruda, which contributed $8.03 billion (+12%), accounting for roughly 49% of total revenue. Animal Health added 13% growth. Within the Alliance segment, BMS Reblozyl royalties rose from $119 million to $148 million (+24.4%). The concentration of roughly half of total revenue in a single product facing a 2028 patent cliff is a more material fact than the growth rate itself. - The 55.9% surge in intangible amortization indicates that recently acquired pipeline assets have entered active amortization.
The "adjusted to profit" claim does not hold: This point requires precision. Adding back the $9.0 billion Cidara charge to the net loss produces a pro-forma figure of approximately +$4.76 billion, or roughly +$4.30 billion using the $8.54 billion cash-flow add-back — but these are back-of-envelope calculations that add a pre-tax item to an after-tax loss figure, not a formally prepared non-GAAP reconciliation. In fact, Merck's own reported non-GAAP result was a loss of $1.28 per share — the company itself did not exclude the Cidara charge ($3.62 per share) from its non-GAAP presentation. The result did beat consensus (expected loss of $1.51 per share). The accurate characterization is therefore "a reported quarterly loss even by the company's own non-GAAP measure, though better than expected" — not "a paper loss masking an underlying profit."
2-2. Fixed vs. Variable Cost Structure
The 10-Q presents costs in summary form, but the cash flow statement adjustments and footnotes reveal the following structure.
Fixed-cost items - Depreciation $581M + intangible amortization $931M → total $1.512 billion (9.3% of revenue) - Restructuring charges: $466 million — comprising accelerated depreciation $108M + workforce reductions $123M + other exit costs $235M (see Section 4 ④ for program-level detail)
Variable-cost items - Cost of collaboration revenues shows wide variability by product: Lenvima fell from $60M to $13M (-78%), while Adempas/Verquvo moved from $58M to $67M and Lynparza held near flat at $83M–$84M
Operating leverage: Revenue grew 4.9% while intangible amortization rose 55.9%, creating structural pressure on reported margins. Collaboration royalties for Lynparza, Lenvima, and Reblozyl carry no cost of goods and therefore provide a partial margin offset.
3. Cash Flow Statement Analysis
| Item | Q1 2025 ($B) | Q1 2026 ($B) | Change |
|---|---|---|---|
| Operating cash flow | 2.500 | 3.918 | +1.418 (+56.7%) |
| Investing cash flow | -1.487 | -10.210 | -8.723 (Cidara outflow of $8.779B) |
| Financing cash flow | -5.755 | -2.981 | +2.774 (lower debt repayment and buybacks) |
| Ending cash + restricted cash | 8.732 | 5.398 | -3.334 |
Note on figures: The ending balance of $5.398 billion includes restricted cash of $71 million. The $5.327 billion on the balance sheet and the $5.398 billion here differ by $71 million — the two figures use different definitions, not different data.
Key points: 1. Operating cash flow improved 56.7% despite the $4.2 billion net loss. The Cidara-related R&D charge contributed an $8.54 billion non-cash add-back, and working capital improvement (from -$3.712B to -$1.613B) compounded the effect. The roughly $460 million not added back represents the portion of the $9.0 billion charge that involved actual cash outflows, primarily share-based compensation settlements. 2. $8.779 billion Cidara acquisition payment dominated investing activity. Capital expenditures fell from $1.328B to $991M (-25.4%) — typical discipline during large M&A cycles. 3. Financing outflows narrowed (-$5.755B → -$2.981B) largely due to lower debt repayment (from $2.5B to $1.14B) and a net short-term borrowing increase of $1.061B (versus zero in the prior-year period), alongside reduced buybacks ($1.164B → $874M). Dividends edged up from $2.050B to $2.105B (+2.7%).
Free cash flow (FCF) = Operating CF – CapEx - Q1 2025: $2.500B – $1.328B = $1.172 billion - Q1 2026: $3.918B – $991M = $2.927 billion (+150%, or 2.5x)
On an FCF basis, Merck's cash generation nearly tripled. A significant portion of the improvement, however, stems from favorable working capital movements (a $2.1 billion swing) and lower capex rather than a structural uplift in operating profitability. The divergence between the reported loss and underlying cash generation remains the defining insight of the quarter.
4. Additional Analysis
① Cidara + Terns: Sequential M&A as Pipeline Reset January: Cidara ($9.2B, MK-1406 long-acting anti-influenza antibody, Phase 3). March: Terns ($6.7B, TERN-701 BCR::ABL1 inhibitor, Phase 1/2, CML target). Combined announced M&A for the quarter: $16.0 billion. This is an accelerated diversification effort ahead of Keytruda's 2028 patent cliff. The Cidara deal included assumption of a J&J licensing agreement carrying potential regulatory milestones of up to $105 million and sales milestones of up to $455 million, for a total potential obligation of up to $560 million. The Terns transaction carries no contingent consideration.
② Daiichi Sankyo ADC Collaboration — Scale Confirmed Three ADC assets (patritumab deruxtecan, ifinatamab deruxtecan, raludotatug deruxtecan) plus gocatamig (MK-6070). Upfront payment of $4.0 billion in 2023 (of which $1.0 billion is subject to pro-rata refund on early termination) + $1.5 billion in continuation payments already made (patritumab: $750M in October 2024; raludotatug: $750M in October 2025) + up to $5.5 billion in sales milestones per ADC (up to $16.5 billion for three combined) = cumulative and potential total of approximately $22.0 billion. Q1 R&D collaboration costs alone totaled $160M (vs. $128M a year earlier) — signaling accelerating clinical progress.
③ AstraZeneca Collaboration Restructured — Koselugo Revenue Simplified An August 2025 amendment to the agreement terminated the Koselugo profit-sharing arrangement, converting Merck to a payment recipient. Merck received $150 million in Q1 2026 (recorded as Alliance revenue). The 2027 ($150M) and 2028 ($100M) installments are contingent on AstraZeneca's annual January elections, and AstraZeneca retains the option to revert to the original profit-sharing structure in January 2027 or January 2028 — these are not committed cash flows. Regulatory milestones totaling $175 million were fully recognized as revenue in 2025, with cash to be collected in three installments: $50M and $50M in Q3 2026 and Q3 2027, and $75M in Q3 2028. Separately, Merck retains the right to receive up to $235 million in sales milestones from AstraZeneca.
④ Restructuring — Two Programs Running Concurrently at Different Completion Stages The $466 million Q1 restructuring charge combines two programs with distinct profiles. Treating them as one leads to misreading the trajectory.
| Program | Total Scope | Cash/Non-cash Mix | Q1 Charge | Cumulative Spend | Completion Rate | Target Completion |
|---|---|---|---|---|---|---|
| 2025 Program (approved Jul 2025) | $3.0B | ~60% cash | $318M | $2.3B | ~77% | Mostly by end-2027; some manufacturing into end-2029 |
| 2024 Program (approved Jan 2024) | $4.0B | ~50% non-cash (accelerated depreciation) | $148M | $1.8B | ~45% | End-2031 |
The widely cited "77% complete" figure applies to the 2025 program only. On a combined basis, $4.1 billion has been spent of a total $7.0 billion, implying an overall completion rate of roughly 59%, with the tail extending to 2031. The programs cover headcount reductions across commercial, administrative, and R&D functions, plus rationalization of global real estate and manufacturing — with parallel hiring in high-growth areas, making this a workforce portfolio rebalancing rather than a pure reduction.
⑤ Blackstone $700 Million sac-TMT Development Funding (contract signed October 2025; cash receipt expected Q4 2026) Merck signed an agreement with Blackstone Life Sciences in October 2025 under which it will receive $700 million to fund development of sac-TMT (MK-2870, an ADC developed in partnership with Kelun-Biotech) in Q4 2026, with no repayment obligation absent contract termination. In Q1 2026, Merck pre-recognized $200 million of this as a reduction to R&D expense and recorded the same amount as a receivable within other current assets. The consideration Blackstone receives is a low-to-mid single-digit royalty on U.S. net sales in the first-line triple-negative breast cancer indication (TroFuse-011), should that approval occur, extending to all indications thereafter. The structure externalizes development costs without diluting equity — but the royalty obligation becomes a permanent drag on economics if and when approvals materialize.
5. Key Implications and Outlook
Company Guidance (Full-Year 2026): Merck raised the low end of its revenue guidance to $65.8 billion–$67.0 billion from a prior $65.5 billion floor, and nudged adjusted EPS guidance to $5.04–$5.16 from $5.00–$5.15. This guidance includes the Cidara charge ($3.62 per share) but excludes the one-time cost related to the pending Terns acquisition (approximately $2.35 per share). When Terns closes in May, full-year adjusted EPS guidance is likely to move lower — reading the current range at face value without that context is a mistake.
Bull case: The $4.2 billion net loss is largely an artifact of GAAP rules requiring immediate expensing of acquired IPR&D, while FCF expanded 2.5x. Core demand remained firm: revenue +4.9%, Keytruda +12%, Animal Health +13%. Multiple pipeline pillars — Daiichi ADCs, Cidara, Terns, and the Blackstone/Kelun sac-TMT program — are advancing simultaneously, and the Q1 loss was narrower than consensus (reported -$1.28/share vs. expected -$1.51/share).
Bear case: (1) The anticipated Terns close in May will trigger an additional $5.8 billion R&D charge, extending the reported-loss streak into Q2. (2) The $5.3 billion cash balance is thin relative to Merck's scale, and the company has already issued notices to draw the full $6.0 billion term loan — further large M&A would require additional debt. (3) Keytruda, representing roughly 49% of revenue, faces a 2028 patent cliff. (4) Potential contingent milestone payments to collaboration partners total approximately $21.4 billion in aggregate (Daiichi ADCs $16.5B + Eisai $2.3B + AstraZeneca $2.0B + assumed J&J obligation $560M). The company has not accrued these as liabilities, judging the probability of triggering them as not probable. (5) Intangible amortization surged 55.9% and will continue to weigh on margins for several quarters. (6) Restructuring tail extends to 2031.
Bottom line: MRK is simultaneously emitting a large reported accounting loss and improving cash generation — a conflicting signal set. The "adjusted to underlying profit" narrative is not supported by the company's own non-GAAP result (loss of $1.28 per share). The accurate picture is: one-time charges produced the quarterly deficit, but cash generation and underlying demand are intact. Pipeline acquisitions carry three-to-five years of clinical and regulatory risk before translating into revenue, and Keytruda's patent cliff arrives before most of that plays out. Long-term investors focused on cash flow and pipeline option value have reason to examine the name; short-term investors tracking quarterly EPS face at least one or two additional loss quarters ahead.
Sources
- Merck & Co., Inc. Form 10-Q (Q1 2026, filed with the SEC) — all financial statements and footnotes
- Merck Q1 2026 earnings release and full-year guidance (April 30, 2026) — EPS, product-level revenue, guidance
- USD/KRW exchange rate: March 31, 2026 closing rate of KRW 1,537 (exchange-rates.org)
Disclaimer
This report is prepared for informational purposes based on Merck & Co., Inc.'s Form 10-Q filed with the SEC and the company's earnings release, and does not constitute investment advice.