O'Reilly (ORLY) Q1 2026: 8.1% Comps End 3-Year Margin Slide
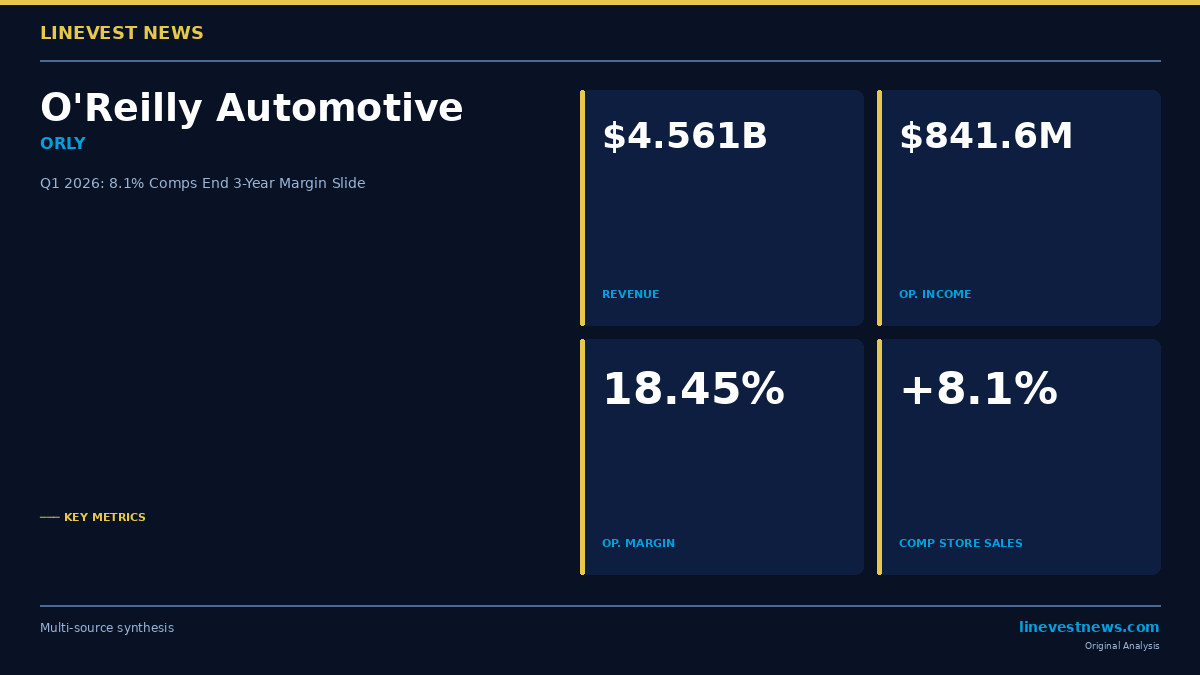
O'Reilly Automotive posted its first first-quarter operating margin expansion in four years, with operating margin rising 53 basis points to 18.45% on an 8.1% comparable store sales gain — reversing a slide that had run from 20.31% in Q1 2022 down to 17.92% in Q1 2025. Sales grew 10.24% to $4.561 billion from $4.137 billion, the fastest first-quarter growth since 2023, and operating income rose 13.51% to $841.6 million from $741.5 million. What makes the quarter genuinely different from the last three is that the company finally grew faster than its fixed cost base: payroll, rent and depreciation together rose 7.54% against a 10.24% sales increase. The offsetting development is on the balance sheet, where a $922.9 million buyback — 152.8% of the quarter's net income — pushed the shareholders' deficit back out to $1.067 billion after five consecutive quarters of narrowing.
Balance Sheet: Assets Barely Move, Equity Deficit Reopens
Total assets grew just 2.41% to $16.937 billion from $16.538 billion at December 31, 2025 — a deliberately asset-light quarter relative to the sales growth.
| Item | Dec 31, 2025 ($M) | Mar 31, 2026 ($M) | Change % |
|---|---|---|---|
| Cash and cash equivalents | 193.8 | 252.6 | +30.4% |
| Accounts receivable, net | 389.8 | 431.2 | +10.6% |
| Inventory | 5,731.4 | 5,810.1 | +1.4% |
| Net property and equipment | 6,257.4 | 6,375.0 | +1.9% |
| Operating lease right-of-use assets | 2,391.2 | 2,450.4 | +2.5% |
| Goodwill | 948.2 | 953.0 | +0.5% |
| Total assets | 16,538.3 | 16,937.2 | +2.4% |
The single most informative line is inventory, up only 1.37% to $5.810 billion while sales grew 10.24%. Receivables rose 10.62%, tracking sales almost exactly, which argues the growth is being collected rather than parked in credit terms. Net property and equipment grew 1.88% even as 59 net new stores opened during the quarter, versus 38 a year earlier — capital expenditures actually fell 14.81% to $244.4 million, which the filing attributes to the timing of store and distribution projects rather than a change in ambition. Under U.S. GAAP these assets sit at historical cost with no revaluation permitted, so a store network built over decades is carried well below any replacement or market value.
Financial versus operating obligations. Financial obligations — long-term debt of $6.195 billion plus $2.536 billion of current and non-current operating lease liabilities — total $8.731 billion. Operating liabilities, led by accounts payable of $7.237 billion, total $9.049 billion excluding $224 million of deferred income taxes. The composition matters more than the total: accounts payable equals 124.6% of inventory (123.9% at year-end), meaning suppliers finance the entire merchandise investment and then some. Note 6 discloses that $5.2 billion of that payable balance sits inside supplier finance programs, up from $5.1 billion — a structure that works smoothly while volumes grow and warrants attention if they stop. Working capital is negative $2.257 billion, widened from negative $2.032 billion; for this business model that is a feature, not a warning.
On maturities, total principal debt of $6.225 billion carries a weighted-average coupon of roughly 4.35%. Approximately 40.6% comes due through 2028 — $525 million of commercial paper at a 4.120% variable rate, $750 million of 5.750% notes due 2026, $750 million of 3.600% notes due 2027 and $500 million of 4.350% notes due 2028. The company refinanced during the quarter, redeeming $500 million of 3.550% notes and issuing $850 million of 5.100% notes due 2036. That is a deliberate trade of near-term maturity risk for a higher coupon, and it is visible in interest expense, up 9.00% to $62.7 million. Operating income still covers interest 13.4 times, and the credit agreement's fixed charge coverage ratio of 6.14 times sits far above the 2.50 minimum, with leverage at 1.92 times against a 3.50 maximum.
Capital structure. Paid-in capital totals $1.546 billion — a rounding error against $16.9 billion of assets. Everything else is a retained deficit of $2.638 billion, deepened from $2.329 billion. The mechanics are exact: net income of $604.2 million, less $904.6 million charged for share repurchases and $8.9 million of repurchase excise tax, equals the $309.3 million deterioration. The resulting total shareholders' deficit of $1.067 billion is a bookkeeping consequence of retiring 1.5 billion shares at an average $19.41 since 2011, not a solvency signal. What is worth noting is the direction: the deficit narrowed for five straight quarters, from $1.439 billion at September 2024 to $763 million at December 2025, and this quarter it reopened by $303.7 million.
Income Statement: Operating Leverage Returns
| Item | Q1 2024 ($M) | Q1 2025 ($M) | Q1 2026 ($M) | 3Y CAGR (Q1'23→Q1'26) |
|---|---|---|---|---|
| Sales | 3,976.2 | 4,136.9 | 4,560.5 | +7.14% |
| Operating income | 752.5 | 741.5 | 841.6 | +5.50% |
| Operating margin (%) | 18.92 | 17.92 | 18.45 | — |
| Net income | — | 538.5 | 604.2 | — |
| Net margin (%) | — | 13.02 | 13.25 | — |
Read across the margin row and the story of the last four years is clear: 20.31% in Q1 2022, then 19.33%, 18.92%, 17.92%, and now 18.45%. Q1 2026 is the first recovery, but it recovers roughly half of one year's erosion — the business is not back to where it started. Growth had decelerated to 4.04% in Q1 2025 before reaccelerating to 10.24% here, so this is a rebound off the softest quarter in the series rather than a step-change in trend.
Operating leverage came in at 1.32 times: every 1% of sales growth produced 1.32% of operating income growth. Gross margin contributed only 19 basis points, rising to 51.47% from 51.28% — improved acquisition costs and distribution efficiency, partially offset by a mix shift toward lower-margin professional customers. The real work was done below the gross line, where SG&A fell 34 basis points to 33.01% of sales.
There were no impairments, restructuring charges or unusual gains in the quarter, so reported operating income of $841.6 million requires no normalization. The one distortion sits in tax: the effective rate rose to 22.55% from 21.31%, which the filing attributes to lower excess tax benefits from share-based compensation. That 124 basis points of rate cost roughly $9.7 million of net income, which is why net income grew 12.20% while pre-tax income grew 13.99%.
Diluted earnings per share rose to $0.72 from $0.62. Computed precisely from the underlying figures, that is $0.7171 versus $0.6230, or +15.1% — of which 12.2 percentage points came from net income and about 2.9 points from a 2.52% reduction in the diluted share count. Roughly one-fifth of the per-share gain was manufactured by the buyback, not earned by the stores. Prior-period share and per-share figures reflect the 15-for-1 stock split distributed June 9, 2025, so the comparison is on a consistent basis.
Fixed versus variable costs. The segment expense disclosure in Note 2 makes the leverage mechanism unusually legible.
| Cost line | Q1 2025 ($M) | Q1 2026 ($M) | Change % | % of sales (Q1'26 vs Q1'25) |
|---|---|---|---|---|
| Team Member compensation | 863.5 | 927.9 | +7.45% | 20.35% vs 20.87% |
| Rent | 113.2 | 119.9 | +5.92% | 2.63% vs 2.74% |
| Depreciation and amortization | 99.0 | 109.0 | +10.13% | 2.39% vs 2.39% |
| Advertising | 19.9 | 22.3 | +11.76% | 0.49% vs 0.48% |
| Other segment items | 283.9 | 325.3 | +14.58% | 7.13% vs 6.86% |
Compensation, rent and depreciation — the genuinely fixed block — grew 7.54% combined against 10.24% sales growth, and payroll alone dropped 52 basis points as a share of sales. Against that, "other segment items," which the filing states includes insurance, utilities, vehicle and banking costs, grew 14.58% and gave back 27 basis points; management specifically cites higher medical and casualty insurance costs. That is the line to watch, because it is the one growing faster than sales.
Cash Flow: Strong, But Timing Did Most of the Work
| Item | Q1 2025 ($M) | Q1 2026 ($M) | Change |
|---|---|---|---|
| Operating cash flow | 755.1 | 1,032.9 | +36.8% |
| Investing cash flow | (285.0) | (244.7) | Outflow narrowed |
| Financing cash flow | (409.5) | (729.0) | Outflow widened |
| Ending cash | 191.2 | 252.6 | +32.1% |
Free cash flow on the simple definition — operating cash flow less capital expenditures — was $788.5 million, up from $468.2 million. The company reports non-GAAP free cash flow of $785.1 million versus $455.2 million, a 72.5% increase; the difference from the simple calculation is that management additionally deducts the excess tax benefit from share-based compensation ($3.4 million this quarter, $12.9 million last year). The adjustment is small and disclosed, and it makes the prior-year base look worse, so the reported growth rate flatters the comparison slightly.
Earnings quality improved on the headline metric, with operating cash flow covering net income 1.71 times against 1.40 times a year ago. But the composition deserves scrutiny. Of the $277.8 million increase in operating cash flow, $175.3 million — 63% — came from working capital timing rather than earnings. Net income contributed $65.7 million and non-cash add-backs $36.8 million. Within working capital, the genuine improvement is net inventory investment: inventory plus payables swung to a $56.5 million source of cash from a $65.1 million use, a $121.6 million swing that reflects real merchandise discipline. Less clear is "other," which contributed $255.7 million against $56.5 million last year, alongside a 43.3% jump in other current liabilities to $804.5 million. The filing does not itemize that composition. Note 13 discloses a remaining $295 million commitment to purchase transferable federal renewable energy tax credits, with the final closing payment anticipated by August 2026, which may be related; either way, accrual-driven cash timing of this scale does not repeat indefinitely.
Capital expenditure discipline is real: capex fell to 5.36% of sales from 6.94%, and this remains overwhelmingly growth spending — 59 new stores plus distribution capacity — not maintenance. Management guides to $1.3–1.4 billion of full-year capex, so Q1's $244 million implies a meaningful step-up over the remaining quarters.
The financing side is where the capital allocation shift shows. Buybacks of $922.9 million exceeded free cash flow of $785.1 million, and the gap was covered by $177.6 million of net new borrowing — $847.4 million of notes issued, less $500 million redeemed, less $163.9 million of commercial paper paydown and $5.9 million of issuance costs. O'Reilly pays no dividend and states it has no plans to. Share-based compensation is a trivial 0.19% of sales, so the buyback is genuinely returning capital rather than offsetting dilution.
What Else Matters
The professional crossover. Sales to professional service providers reached $2.291 billion, overtaking DIY sales of $2.190 billion for the first time in the disclosed comparison — 50.23% of the mix versus 48.31% a year ago. Professional grew 14.62% while DIY grew 6.74%. This is the most consequential trend in the filing, and it cuts both ways: professional volume is stickier and higher-frequency, but the company explicitly states professional sales carry a lower gross margin than DIY. The 19 basis points of gross margin expansion was achieved despite this mix headwind, which makes the underlying procurement and distribution gains larger than they appear.
Traffic is not the driver. Management attributes the 8.1% comp to higher average ticket for both customer groups and higher transaction counts for professional customers, "partially offset by a slight decrease in transaction counts for DIY customers." Ticket growth reflects same-SKU price increases plus the rising complexity and cost of parts on an aging, better-engineered vehicle fleet. The filing is candid that better engineering means less frequent repair, creating structural pressure on transaction counts. Growth built on price and part complexity rather than units is more exposed to any consumer trade-down than a traffic-led comp would be.
Guidance implies sharp deceleration. The accompanying first-quarter earnings release guides full-year comparable store sales to 3.0–5.0%, revenue to $18.7–19.0 billion (+5.2% to +6.8% over FY2025's $17.782 billion), operating margin to 19.3–19.8% and diluted EPS to $3.15–3.25. Holding Q1's 8.1% comp against a full-year 4.0% midpoint implies roughly 2.7% comps across the remaining three quarters, and Q1's $0.72 represents only 22.5% of the EPS midpoint. Either management is being conservative, or it expects the price-driven component of the comp to fade — a distinction the second quarter will settle.
Inventory efficiency remains the structural constraint. Annualizing quarterly cost of goods sold against average inventory implies roughly 1.53 turns, or about 238 days of inventory. That is inherent to a parts business that must stock deep, slow-moving SKUs across 6,644 stores to guarantee same-day availability — the availability itself is the moat. It also means the payables structure, not the inventory, is what generates the cash.
Contingencies are quiet. Note 15 states litigation is incidental to ordinary business and not expected to be material in the aggregate, with no "reasonably possible" loss range disclosed. Foreign currency exposure is limited: net assets in Mexican subsidiaries of $552.5 million, where a 10% move would affect other comprehensive income by roughly $50.2 million with no material effect on operations. Interest rate risk is contained to $525 million of commercial paper, where a 10% rate increase costs $2.2 million annually. None of these are capable of reversing the headline numbers.
Takeaways
What grew. Operating leverage came back after three years of erosion, and it came back through the fixed cost base rather than through pricing alone — payroll fell 52 basis points as a share of sales while gross margin added only 19. Professional service provider sales grew 14.62% and crossed above DIY for the first time, which is where the volume durability lives. The store network expanded by 59 units against 38 a year earlier while capital expenditure fell.
What carries risk. DIY transaction counts declined, and the comp is carried by ticket rather than traffic. Sixty-three percent of the operating cash flow improvement came from working capital timing, including a $199 million swing in an "other" line the filing does not break out. Insurance and other operating costs grew 14.58%, faster than sales. Management's own full-year guidance implies comps decelerating to roughly 2.7% for the balance of the year, so the market is being told not to extrapolate this quarter. And 40.6% of debt matures through 2028 into a coupon environment where the company just swapped 3.550% paper for 5.100% paper.
Capital allocation. The priority ordering is unambiguous and unchanged: growth capex first, then buybacks, no dividend, no meaningful M&A. What changed this quarter is intensity. Repurchases ran at 152.8% of net income and 117.6% of free cash flow, up from 103.9% and 122.9% respectively, funded partly with $177.6 million of net new debt — and the company bought another 4.3 million shares for $398.4 million between quarter-end and May 8, leaving roughly $1.1 billion of the $29.8 billion cumulative authorization. Buying back stock in excess of free cash flow is defensible when leverage sits at 1.92 times against a 3.50 covenant and coverage is 6.14 times; it becomes a different conversation if comps decelerate to the guided 2.7% while the pace holds. The five-quarter narrowing of the equity deficit has stopped, and that reversal is the cleanest single indicator of the shift.
This analysis is based on filings submitted to the U.S. Securities and Exchange Commission and is provided for informational purposes only. It is not investment advice. Source: SEC Form 10-Q, filed May 8, 2026.