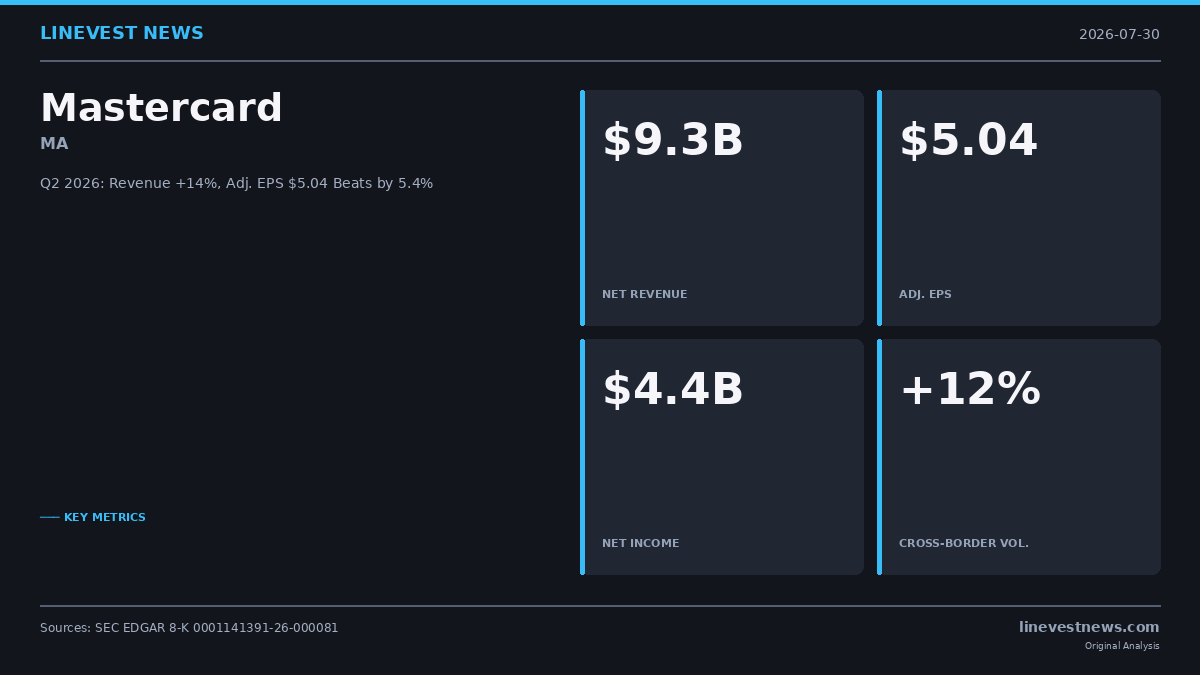
Mastercard Incorporated (NYSE: MA) beat Wall Street expectations on both revenue and adjusted EPS for the second quarter of 2026, filing an 8-K (Items 2.02 and 9.01) with the SEC on July 30. Cross-border volume growth and a fast-expanding services layer drove results above consensus on every key metric.
TL;DR
- Net revenue USD 9.3B (+14% YoY, +12% currency-neutral); beat USD 9.08B consensus by 2.4%
- Adjusted diluted EPS USD 5.04 (+21% YoY); beat USD 4.78 consensus by USD 0.26, or 5.4%
- Gross Dollar Volume USD 2.9T (+8% locally); Cross-Border Volume +12% locally
- Value-Added Services revenue grew 20% YoY (+18% currency-neutral) — fastest segment
- USD 5.7B total capital return in Q2 (USD 4.9B buybacks + USD 771M dividends)
Part A — Q2 2026 Filing Summary
Revenue and Earnings
| Metric | Q2 2026 | Q2 2025 | Change |
|---|---|---|---|
| Net Revenue | USD 9.3B | USD 8.1B | +14% (+12% CN) |
| Operating Income | USD 5.6B | USD 4.8B | +17% |
| Net Income | USD 4.4B | USD 3.7B | +19% |
| GAAP Diluted EPS | USD 4.97 | USD 4.07 | +22% |
| Adjusted Diluted EPS | USD 5.04 | USD 4.15 | +21% |
Operating expenses grew 8.8% to USD 3.7 billion — a slower pace than revenue growth, reflecting continued operating leverage.
Volume Metrics
| Metric | Q2 2026 Local Growth |
|---|---|
| Gross Dollar Volume (GDV) | +8% (USD 2.9T) |
| Purchase Volume | +10% |
| Cross-Border Volume | +12% |
| Switched Transactions | +9% |
Value-Added Services and Solutions — covering fraud prevention, open banking, data analytics, and cybersecurity — grew 20% year-over-year (18% currency-neutral), outpacing core payment network volume growth.
Shareholder Returns
Mastercard repurchased 9.8 million shares for USD 4.9 billion in Q2, leaving USD 7.8 billion under existing buyback authorizations. Dividend payments totaled USD 771 million, bringing total Q2 capital returns to approximately USD 5.7 billion.
Year-to-date through June 30, net revenue reached USD 17.7 billion (+15% YoY), and adjusted diluted EPS was USD 9.64, up 22% from USD 7.87 in the first half of 2025.
CEO Michael Miebach stated: "We delivered above expectations with net revenue growth at 14% year-over-year, or 12% on a currency-neutral basis in the second quarter."
Part B — Investor Analysis
What Drove the Beat
Mastercard's outperformance was broad-based, not the result of a single one-time item.
Cross-border re-acceleration was the headline story. Cross-border volume grew 12% locally — the fastest growth metric in the quarter. Mastercard prices cross-border transactions at higher fee rates than domestic transactions because they involve currency conversion and additional fraud management. This fee structure means that 12% cross-border volume growth generates disproportionately more revenue than an equivalent increase in domestic GDV — the primary reason net revenue grew 14% even as total GDV grew only 8%.
Value-Added Services at 20% growth is structurally significant. The VAS segment includes Mastercard's Safety Net fraud tools, Aiia open banking platform, SpendingPulse analytics, and NuDetect behavioral biometrics. With payment network revenue at approximately USD 8.1 billion out of USD 9.3 billion total net revenue, VAS and other services contributed roughly USD 1.2 billion in Q2 — a small share but growing at approximately 2.5 times the pace of core payment volume. Mastercard has described this segment as its primary revenue diversifier against interchange regulation risk.
Operating leverage held. Revenue grew 14% while operating expenses grew 8.8% — generating 17% operating income growth. This leverage ratio is the compounding mechanism that supports Mastercard's above-market valuation.
Visa Comparison: A Sectoral Trend, Not Just Mastercard
Mastercard's Q2 results closely parallel Visa's Q3 FY2026 (calendar Q2, reported July 29, 2026). Visa posted net revenue of USD 11.6 billion (+14%), payments volume +10%, cross-border volume +12% excluding intra-European transactions, and processed transactions +10%. The near-identical growth rates at both networks confirm that strong Q2 performance reflects genuine global payment volume strength, not company-specific execution.
Both networks benefit from the same tailwinds: resilient U.S. consumer spending, recovering international travel, and growing digital payment adoption in emerging markets. The FIFA World Cup 2026 — hosted across U.S., Canadian, and Mexican cities from June 11 through July 19 — generated significant incremental cross-border transaction volume during the quarter, particularly from Latin American and European travelers.
Consumer Spending Signal
For investors attempting to read macro health from payment network data, Mastercard's Q2 metrics provide a constructive picture:
- GDV +8% with purchase volume +10% suggests spending growth is above trend, with the count of purchases growing faster than total dollar value — consistent with consumer breadth rather than inflation-driven ticket-size growth.
- Switched transactions +9% (individual card swipes processed by Mastercard) indicates consumers are increasing the frequency of card-based transactions.
- The currency-neutral cross-border figure (+12%) strips out FX distortions, suggesting real underlying international travel and e-commerce demand remains intact.
Mastercard's SpendingPulse data — a proprietary tracker covering retail sales across all payment types — has been consistent with these trends throughout 2026, indicating that consumer spending remains resilient even as credit card delinquency rates have edged higher at the banking level.
Capital Allocation: Four Quarters of Buybacks Remaining
Mastercard repurchased USD 4.9 billion of its own shares in Q2, or approximately 0.87% of its market capitalization at pre-earnings prices. The USD 7.8 billion remaining authorization is enough to sustain the current buyback pace for roughly four more quarters.
Combined with USD 771 million in dividends, the company returned USD 5.7 billion to shareholders in a single quarter — funded by free cash flow from a capital-light business model that requires relatively modest incremental capital expenditure to sustain growth.
Risk Factors for the Remainder of 2026
1. Guidance absent from press release. Mastercard did not provide Q3 2026 or full-year outlook in the earnings press release, consistent with the company's convention of reserving guidance for the earnings call. Investors should monitor management's tone on Q3 cross-border trends, as World Cup tailwinds fade after July.
2. Client incentive trajectory. Operating expenses grew 8.8% — slightly below revenue growth, which is favorable for margins. However, if major issuer renewals or competitive pressures require accelerated incentive payments in H2 2026, margin compression could exceed the pace the top-line growth implies.
3. Regulatory overhang. The U.S. Department of Justice's investigation into debit card routing market structure and the European Commission's scrutiny of card scheme fees remain unresolved. Neither moved materially closer to resolution in Q2, but either could produce headline risk if enforcement action advances.
4. FX headwinds. The 2-percentage-point gap between reported growth (14%) and currency-neutral growth (12%) reflects U.S. dollar strength. Further dollar appreciation against the euro, British pound, or emerging market currencies in H2 2026 would widen the FX drag on reported results.
5. World Cup comparison base effect. The fact that both Visa and Mastercard posted +12% cross-border growth in Q2 sets a high comparison base. If World Cup-related cross-border activity does not re-accelerate with new catalysts, the year-over-year comparison becomes increasingly difficult in Q3.
Valuation Snapshot
| Metric | Value |
|---|---|
| MA Pre-Earnings Close (Jul 29) | USD 563.32 |
| Analyst Mean Price Target | ~USD 644-649 |
| Implied Upside | ~14-15% |
| Analyst Coverage | 31 Buy / 4 Outperform / 4 Hold |
| H1 2026 Adjusted EPS | USD 9.64 |
| Annualized Adj. EPS Run-Rate | ~USD 19.28 |
| P/E (pre-earnings, forward) | ~29x |
At approximately 29 times forward adjusted earnings, Mastercard trades at a premium to broad market indices but in line with historical levels for a business generating consistent mid-teens revenue growth and 20%+ earnings-per-share growth. The USD 5.04 adjusted EPS versus the USD 4.78 consensus represents a meaningful beat that, combined with solid volume trends, provides a constructive setup for the stock heading into the earnings call.
This article is based on Mastercard's SEC 8-K filing (Accession No. 0001141391-26-000081, filed July 30, 2026). All figures are sourced directly from the earnings press release (Exhibit 99.1) unless otherwise noted. This article is for informational purposes only and does not constitute investment advice.
Sources: - SEC EDGAR: Mastercard 8-K (0001141391-26-000081), filed July 30, 2026 - Mastercard Exhibit 99.1 (Q2 2026 Earnings Press Release) - Visa Inc. 8-K (0001403161-26-000103), filed July 29, 2026 - Scanx.trade: Mastercard Q2 2026 analyst consensus estimates - Benzinga: Mastercard analyst ratings and price target coverage, July 2026