Alphabet (GOOGL) Q2 2026: Net Income Quadruples to $112.2B as Cloud Revenue Surges 82% — But Half the Headline Is an Accounting Illusion
By LineVest News | July 29, 2026
Alphabet Inc. reported what may be the most statistically dramatic quarter in its history on Tuesday, posting Q2 2026 results that sent headline net income surging nearly four-fold to $112.193B. Yet investors parsing the numbers carefully will find two parallel stories running simultaneously: an operating business that continues to accelerate in genuinely impressive fashion, and an accounting event of historic proportions driven largely by unrealized gains on private equity holdings — gains that cannot be spent, returned to shareholders, or easily converted to cash.
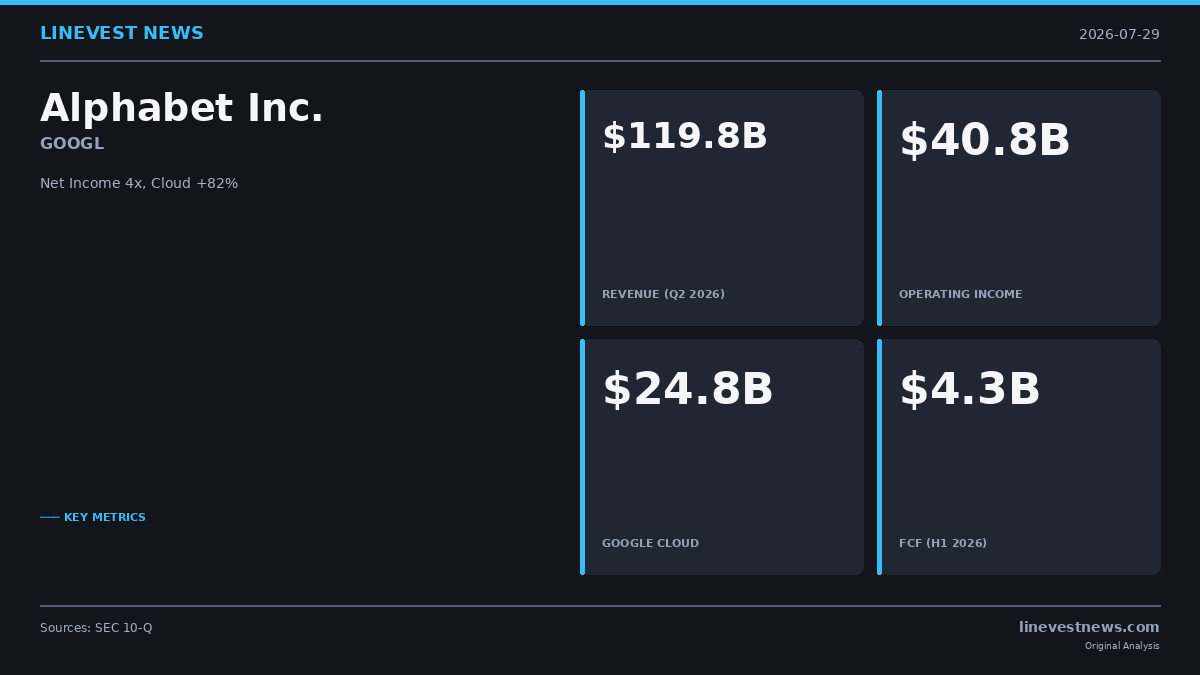
Revenue came in at $119.796B, up 24.2% from $96.428B in Q2 2025, while operating income reached $40.770B, a 30.4% increase that expanded the operating margin by 160 basis points to 34.0%. These figures alone would have made for a strong earnings release. But the net income figure of $112.193B — representing a 297.9% year-over-year surge and a net margin of 93.7% — demands immediate context: $99.031B in other income from equity fair value adjustments, comprising $77.354B in unrealized gains on private investments (predominantly SpaceX), $21.399B in publicly traded equity gains, and $0.278B in realized gains, collectively account for roughly 88% of reported net income.
The company's 10-Q filing does not separately disclose SpaceX's individual contribution to these figures. What it does confirm is that the underlying operational engine — particularly Google Cloud — is running at a pace that warrants genuine investor attention regardless of the accounting noise.
Section 1: Consolidated Balance Sheet Analysis
1-1. Key Asset Line Items (Dec. 31, 2025 → Jun. 30, 2026, in USD millions)
| Item | Prior Period | Current Period | Change | Commentary |
|---|---|---|---|---|
| Cash & Cash Equivalents | 30,708 | 55,911 | +82.1% | Liquidity surge from preferred/common stock and bond issuances |
| Marketable Securities | 96,135 | 186,563 | +94.1% | SpaceX and other holdings reclassified following listing events (~$80B) |
| Accounts Receivable (net) | 62,886 | 69,175 | +10.0% | Moderate growth relative to revenue — healthy collection management |
| Inventory | 2,439 | 9,991 | +309.6% | TPU system sales expansion + Pixel device inventory build |
| Property & Equipment (net) | 246,597 | 321,212 | +30.3% | AI data center CapEx surge reflected |
| Intangible Assets (net) | 1,283 | 9,105 | +609.7% | Wiz acquisition (~$8.3B intangibles) reflected |
| Goodwill | 33,380 | 57,828 | +73.2% | Wiz ($22.7B) + Intersect ($2.2B) acquisition goodwill |
In-Depth Analysis: The 309.6% explosion in inventory — a quadrupling in just six months — is not a routine supply chain build. It reflects a strategic inflection point: Alphabet has begun selling its proprietary TPU (Tensor Processing Unit) systems directly to enterprise customers, positioning its in-house silicon as a competitive alternative to Nvidia's GPU platforms. To support this product push, the company has stockpiled substantial hardware inventory, now approaching $10B on the balance sheet.
For Korean semiconductor investors, this development carries significant implications. Samsung Electronics and SK Hynix should interpret Alphabet's $10B inventory build as a powerful demand signal for HBM (High Bandwidth Memory), since TPUs — like GPUs — are voracious consumers of HBM. The message is that even as Alphabet reduces its dependency on Nvidia, the underlying memory demand profile remains structurally intact.
On the fixed asset side, Property & Equipment expanded by $74.6B in a single half-year period. This figure reflects $80.6B in capital expenditures, $5.1B in property and equipment acquired through the Intersect acquisition, partially offset by $13.6B in depreciation. The goodwill and intangible asset net increase of approximately $32B is the direct result of Alphabet's $33.7B in cash deployed for acquisitions during the period.
1-2. Liability Structure — Financial vs. Operating Obligations
Financial Liabilities
Alphabet's financial liability profile underwent a dramatic transformation in the first half of 2026:
- Long-term debt: $46,547M → $98,165M (+110.9%) — net bond issuances of approximately $50.9B during the half-year
- Deferred tax liabilities: $919M → $22,819M (+2,383.6%) — estimated to reflect the recognition of deferred taxes on unrealized equity fair value gains during the period (the 10-Q does not separately disclose individual attribution)
- Non-current income taxes payable: $9,531M → $11,306M (+18.6%)
Operating Liabilities
- Accounts payable: $12,200M → $20,258M (+66.0%) — reflects $29.1B in CapEx-related accrued capital expenditures (disclosed as non-cash investing activity) and acquisition settlement flows
- Accrued expenses: $55,557M → $73,014M (+31.4%)
- Traffic Acquisition Costs (TAC) payable: $10,864M → $10,599M (-2.4%) — partner payments remain stable, a positive signal for advertising partner relationships
- Deferred revenue: $6,578M → $7,154M (+8.8%)
Total liabilities increased by approximately $101.5B over six months. Critically, roughly half ($51.6B) represents real financial debt through bond issuances, while approximately $21.9B represents a deferred tax liability tied to unrealized equity appreciation — an accounting obligation that will only crystallize into a cash outflow when and if Alphabet actually sells the underlying holdings.
1-3. Capital Structure Analysis
The equity section tells an equally dramatic story:
- Preferred stock + additional paid-in capital: $0 → $18,023M — newly established in Q2. Alphabet issued 19 million shares of 6.25% mandatory convertible preferred stock with a liquidation value of $19.0B
- Common stock + additional paid-in capital: $93,126M → $131,371M (+41.1%) — $30.5B in proceeds from new common stock issuances
- Retained earnings: $324,055M → $493,371M (+52.2%) — half-year net income of $174.8B less approximately $5.5B in dividends added $169.3B to accumulated earnings
- Share repurchases: $0 (vs. -$28.31B in H1 2025)
- Total equity: $415,265M → $640,480M (+54.2%)
The most consequential strategic signal embedded in Alphabet's balance sheet is the complete suspension of share buybacks. Historically, Alphabet has returned $13–15B per quarter to shareholders through repurchases, a mechanism that mechanically boosted earnings per share by reducing the share count. In H1 2026, the company bought back zero shares — while simultaneously raising $105.6B in fresh capital through preferred stock, common stock, and corporate bonds.
The message is unambiguous: in the current AI arms race, securing ammunition takes priority over shareholder returns. Whether this trade-off proves strategically sound — or whether it represents a peak-cycle capital deployment decision that will pressure returns over the next several years — will likely be the defining debate for Alphabet investors heading into 2027.
Section 2: Consolidated Income Statement Analysis
2-1. Core Profitability Metrics (Q2 2025 → Q2 2026, USD millions)
| Metric | Q2 2025 | Q2 2026 | YoY Change |
|---|---|---|---|
| Revenue | 96,428 | 119,796 | +24.2% |
| Operating Income | 31,271 | 40,770 | +30.4% |
| Operating Margin | 32.4% | 34.0% | +1.6 ppts |
| Net Income | 28,196 | 112,193 | +297.9% |
| Net Margin | 29.2% | 93.7% | +64.5 ppts |
Segment Revenue Breakdown (Q2, USD millions)
| Segment | Q2 2025 | Q2 2026 | YoY Change |
|---|---|---|---|
| Google Search | 54,190 | 63,271 | +16.8% |
| YouTube Advertising | 9,796 | 11,055 | +12.9% |
| Google Network | 7,354 | 7,303 | -0.7% |
| Subscriptions, Platforms & Devices | 11,203 | 12,911 | +15.2% |
| Google Cloud | 13,624 | 24,768 | +81.8% |
In-Depth Analysis
Cloud as the Singular Growth Driver: Of Alphabet's $23.4B in total revenue growth this quarter, Google Cloud contributed approximately half on its own — a remarkable concentration of incremental revenue generation. More striking still is the forward-looking picture: Alphabet's total revenue backlog stands at $519.5B, of which $513.9B is attributable to Cloud. Management has indicated that it expects to recognize slightly more than 50% of this backlog as revenue over the next 24 months — implying an annualized recognition rate equivalent to approximately 1.1 years of the company's current total revenue. Put differently, Alphabet now has more contracted Cloud revenue awaiting recognition than most Fortune 500 companies generate in annual sales.
Search Advertising Re-Accelerates: Google Search growing at 16.8% directly refutes — at least for this quarter — the persistent market concern that AI Overviews and Gemini-integrated search would cannibalize advertising monetization. The actual evidence suggests that AI-enhanced search is, if anything, drawing more user engagement and supporting stronger ad load. Whether this trend is durable as AI agents increasingly mediate between users and advertisers remains an open question, but Q2 2026 data does not support the bearish narrative.
The Anatomy of 298% Net Income Growth: Alphabet reported $97.983B in other income and expense for Q2 2026, compared to $2.662B in Q2 2025 — a 3,580% increase in a single line item. Of this figure, $77.354B represents unrealized fair value appreciation on private investments and $21.4B represents gains on publicly traded equity holdings. The operating business, viewed in isolation, delivered a genuinely impressive 30.4% increase in operating income. However, the "net income quadrupled" headline is predominantly an accounting reclassification event, not a reflection of cash-generative business performance. This distinction is not merely academic — it has direct implications for valuation, dividend capacity, and the sustainability of reported earnings.
2-2. Fixed Cost vs. Variable Cost Dynamics
Fixed-Cost Profile
The fixed-cost base expanded materially across all categories: - R&D expense: $18,219M (+31.9%) — Gemini model development, TPU engineering, and AI research headcount driving growth - Sales & marketing: $8,403M (+18.3%) - General & administrative: $6,461M (+24.0%) - Depreciation (H1 cumulative): $13,586M (+43.2% YoY) — data center infrastructure depreciation accelerating - Stock-based compensation (H1 cumulative): $14,708M (+27.7%)
The 43.2% year-over-year surge in depreciation expense is a lagging indicator of prior CapEx cycles — and it signals what is coming. With H1 2026 CapEx running at $80.6B (on a pace to exceed $160B for the full year), the corresponding depreciation charge will begin flowing through the income statement with a 12–24 month delay. This creates a structural headwind to margins that will intensify through 2027 and 2028 even if revenue growth moderates.
Variable-Cost Profile
Cost of revenue came in at $45,943M, representing 38.4% of revenue — a 210 basis point improvement from the 40.5% ratio in Q2 2025. The primary driver is product mix: Google Cloud (which carries a structurally lower TAC burden than network advertising) and high-margin subscription and YouTube Premium revenues are growing faster than the overall business, diluting the cost-of-revenue ratio in Alphabet's favor.
The net operating leverage effect is clear: revenue grew 24.2% while total costs increased 21.3%, generating the 160 basis point margin expansion to 34.0%. However, with depreciation growing at 43% — nearly double the revenue growth rate — this favorable dynamic faces increasing pressure as the CapEx supercycle matures.
Section 3: Cash Flow Statement Analysis (H1 2026 Cumulative, USD millions)
| Item | H1 2025 | H1 2026 | Change |
|---|---|---|---|
| Operating Cash Flow | 63,897 | 84,859 | +32.8% |
| Investing Cash Flow | (40,738) | (145,822) | Outflow 3.6x larger |
| Financing Cash Flow | (26,033) | 86,320 | Positive swing |
| Ending Cash Balance | 21,036 | 55,911 | +165.8% |
Operating Cash Flow (+32.8%): Because the vast majority of reported net income consists of non-cash fair value adjustments, the operating cash flow figure — which adds back non-cash items — provides a cleaner window into actual business cash generation. The $84.859B figure reflects genuine operational strength. Deferred income tax increases of $27.538B within operating cash flow are estimated to relate primarily to tax provisions on SpaceX-related unrealized gains.
Investing Cash Flow (outflow 3.6x larger): The dramatic expansion in investing outflows is driven by two categories: capital expenditures of $80.6B (vs. $39.64B in H1 2025, +103.3%), and acquisition-related cash payments of $33.7B (primarily attributable to the Wiz acquisition). Together these represent a fundamental statement of strategic intent — Alphabet is deploying capital at a rate not seen in its history.
Financing Cash Flow (positive swing): The $86.320B positive financing flow is the algebraic sum of: net bond issuances +$50.9B, preferred stock proceeds +$19.06B, common stock proceeds +$30.5B, zero in share repurchases, and dividends paid of -$5.23B. This is the financing structure of a company in aggressive expansion mode, not a mature cash-return vehicle.
Free Cash Flow (FCF = Operating CF − CapEx): $4.26B (vs. $24.25B in H1 2025, -82.4%). This figure is, arguably, the most important number in the entire earnings release for long-term investors. Alphabet's ability to generate substantial free cash flow has historically been the bedrock of its investment thesis — enabling buybacks, dividend initiations, and opportunistic M&A without recourse to external capital markets. With FCF collapsing to $4.26B while CapEx doubles, the company has become temporarily dependent on debt and equity issuance to fund its growth ambitions. This is not inherently catastrophic if the investments generate returns — but it is a material change in the company's financial character.
Section 4: Five Critical Issues Every Investor Must Understand
Issue 1: Alphabet Holds $94.1B in SpaceX Shares — But Cannot Easily Sell Them
The $186.563B in marketable securities on Alphabet's balance sheet includes approximately $80B reclassified from private to marketable following SpaceX-related developments, but management has disclosed that approximately $80B of this position carries short-term transfer restrictions, while $14.1B in other non-current assets carries long-term restrictions extending to at least Q3 2027. The $77.354B in unrealized private investment gains — and whatever portion is attributable to SpaceX — represents accounting income, not accessible liquidity. Investors should be cautious about equating paper gains with financial flexibility.
Issue 2: Google Cloud Backlog of $513.9B — Five Times Annual Cloud Run-Rate Revenue
At a current annualized Cloud revenue pace approaching roughly $100B, the $513.9B backlog represents approximately five years of forward contracted demand. More practically, with management guiding for roughly 50%+ backlog recognition within 24 months, the near-term revenue visibility is exceptional. For Korean investors specifically, this backlog represents the demand reservoir feeding HBM3E and HBM4 procurement: every additional data center server in Alphabet's build-out requires high-bandwidth memory, and with Alphabet now also selling TPU systems externally (building $9.991B in inventory), the semiconductor demand implications extend beyond Alphabet's own infrastructure.
Issue 3: H1 CapEx of $80.6B — Pacing Toward $160B+ Annually
To contextualize the scale: Alphabet's entire 2023 annual CapEx was approximately $32.3B. The H1 2026 figure of $80.6B — double the prior-year comparable and the highest six-month capex in the company's history — reflects a commitment to AI infrastructure that is now measured in hundreds of billions. Data centers, networking equipment, servers, and semiconductor components (Nvidia GPUs and Alphabet's own TPU-related HBM procurement) are the primary beneficiaries. For Korean memory and foundry players, this is an unambiguously positive demand signal.
Issue 4: Wiz Acquisition ($29.5B) + Intersect Acquisition ($5.9B) — $33.7B in H1 Acquisition Spending
The purchase price allocation for Wiz, disclosed in Note 8 of the 10-Q, assigns $8.3B to intangible assets, $22.7B to goodwill, and reflects a net assumed liability position of approximately -$1.5B. The strategic rationale is clear: Alphabet is using Wiz to position Google Cloud as the premier secure cloud platform for enterprise customers, directly challenging AWS and Azure on cybersecurity credentials. For companies such as Palo Alto Networks and CrowdStrike, Alphabet's entry into integrated cloud security through a $29.5B bet represents a meaningful competitive escalation.
Issue 5: 6.25% Mandatory Convertible Preferred Stock — A Dilution Reservation
Alphabet issued 19 million shares of 6.25% mandatory convertible preferred stock with a $19.0B liquidation value during Q2. The company simultaneously purchased capped call instruments at a cost of $1.01B to partially offset the dilutive impact at conversion. Upon mandatory conversion, common shareholders will experience dilution — the magnitude of which will depend on Alphabet's share price at the conversion date. The company has already recognized $86M in preferred dividends in Q2. Existing common shareholders should factor this future dilution into their return calculations.
Section 5: Investment Implications and Forward Outlook
Bull Case
The optimistic scenario for Alphabet rests on four pillars:
First, Google Cloud's 81.8% growth rate — if it sustains even a fraction of this trajectory — represents a structural shift that could see Alphabet legitimately challenging AWS for the number-one position in enterprise cloud infrastructure by 2028. The $513.9B backlog provides quantitative support for continued elevated growth.
Second, Alphabet's vertical integration into TPU hardware — bypassing Nvidia for a growing share of its own AI compute — both reduces cost exposure and creates a new revenue stream. The $9.991B in inventory confirms this is no longer a pilot program.
Third, Search advertising growing at 16.8% while AI Overviews are actively deployed puts to rest, at least temporarily, the monetization cannibalization thesis. If Alphabet can maintain mid-teens growth in search while simultaneously building a $100B+ cloud business, the combined revenue trajectory is formidable.
Fourth, the equity portfolio — even accounting for lock-up restrictions — represents substantial option value. A successful SpaceX IPO or secondary liquidity event could unlock tens of billions in realized gains and cash.
Bear Case and Key Risks
Free cash flow collapse: FCF of $4.26B in H1 represents an 82.4% year-over-year decline. If CapEx remains at the $160B+ annualized pace — and management has given no indication it will moderate — Alphabet will remain dependent on external capital markets for the foreseeable future. This is a qualitatively different company from the cash-generating machine of 2022–2024.
Shareholder return reversal: The complete suspension of share buybacks will likely draw criticism from return-oriented institutional investors. The question of when buybacks resume — and at what cost to financial flexibility — will be a recurring theme in analyst calls.
Deferred tax time bomb: The $21.9B surge in deferred tax liabilities represents a future cash obligation that will crystallize when Alphabet eventually monetizes its equity holdings. A SpaceX liquidity event, while financially beneficial, would trigger a substantial tax outflow simultaneously.
Depreciation headwind: With H1 depreciation already up 43.2% and CapEx doubling, the amortization drag on operating margins will intensify through 2027–2028. Management's current 34.0% operating margin could face 200–300 basis points of structural pressure from this source alone.
Integration and regulatory risk: Simultaneously integrating Wiz and Intersect — while managing ongoing antitrust scrutiny across Search, advertising, and app distribution — represents a significant operational and legal bandwidth commitment.
Implications for Korean Market Investors
Samsung Electronics & SK Hynix: The most direct read-through is positive. Alphabet's CapEx doubling to a $160B+ annualized pace translates directly into accelerating procurement of DRAM, NAND, and most critically HBM3E and HBM4 for both Nvidia GPUs and Alphabet's own TPU systems. The $9.991B inventory build in TPU systems specifically confirms that HBM demand from Alphabet is growing through two independent channels — third-party GPU procurement and proprietary TPU volume. For SK Hynix, which supplies HBM3E to both Nvidia and Google TPU programs, this is a demand confirmation of the highest order.
Naver & Kakao: Google Search advertising re-accelerating at 16.8% is a mixed signal for domestic Korean internet platforms. On the one hand, it confirms that AI-enhanced search monetization is viable — a template both companies are pursuing. On the other hand, it reinforces the competitive dominance of the global platform, and any acceleration in Google's Korean market ambitions (search, YouTube, cloud) would intensify pressure on domestic advertising revenue pools.
Korean Cloud and IT Services (KT Cloud, Naver Cloud, Samsung SDS): The widening gap between the global hyperscalers and regional players — now quantified by a $513.9B backlog figure that exceeds the annual GDP of most countries — makes domestic competition increasingly asymmetric. Korean enterprises evaluating cloud vendors face an increasingly stark capability differential, and domestic providers will need to identify defensible niches rather than compete on breadth.
Summary Assessment
Alphabet's Q2 2026 results present a study in the importance of analytical decomposition. The headline "net income quadrupled" narrative is technically accurate but substantially misleading: approximately $99B of $112.2B in reported net income consists of unrealized equity gains, primarily from SpaceX holdings subject to meaningful transfer restrictions. Strip away the accounting event, and what remains is a 30.4% increase in operating income, an 81.8% surge in Cloud revenue, and a 16.8% re-acceleration in Search — genuinely impressive results by any standard.
The more consequential story, however, may be the cash flow statement. Free cash flow of $4.26B in H1 2026 versus $24.25B in H1 2025 represents a structural shift, not a temporary fluctuation. Alphabet has chosen to prioritize AI infrastructure investment at a scale that has temporarily neutralized one of its most valuable financial characteristics: the ability to generate abundant free cash while simultaneously returning capital to shareholders. Whether the $80.6B in H1 CapEx — and whatever follows in H2 — generates returns that justify the investment is the question that will define Alphabet's investment narrative for the next three to five years.
For now, the company has made its strategic bet unmistakably clear: Cloud infrastructure and AI compute are the future, and Alphabet intends to win.
This report is prepared for informational purposes based on Alphabet Inc.'s 10-Q Quarterly Report filed with the SEC and does not constitute investment advice. LineVest News — linevestnews.com