Oracle (ORCL) FY2026: $638B Backlog, Free Cash Flow -$23.7B
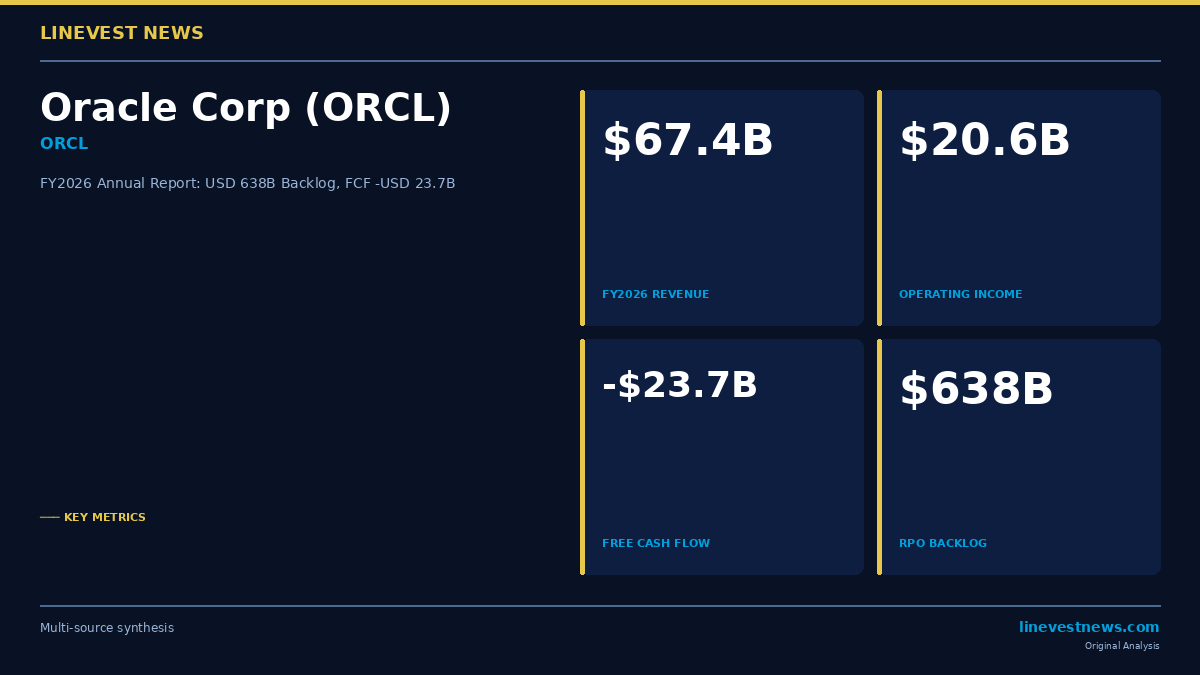
Oracle closed fiscal 2026 with $638 billion of contracted-but-unrecognized revenue on its books — 9.5 times the $67.4 billion it actually booked as revenue during the year, and up from $138 billion twelve months earlier. The company spent $55.7 billion on capital expenditures to chase that demand, against $32.0 billion of operating cash flow, producing negative free cash flow of $23.7 billion and forcing $46.1 billion of new senior notes plus a $5.0 billion mandatory convertible preferred issue. The tension in this filing is not whether demand exists; the disclosure is unambiguous that it does. It is whether a software company with a 30% operating margin can finance an infrastructure buildout of this scale without the economics of the underlying contracts becoming the whole investment case.
1. Consolidated Balance Sheet
1-1. Principal Asset Items
| Item | FY2025 ($M) | FY2026 ($M) | Change % |
|---|---|---|---|
| Cash and cash equivalents | 10,786 | 31,289 | +190.1% |
| Accounts receivable, net | 8,558 | 10,385 | +21.3% |
| Property, plant and equipment, net | 43,522 | 99,957 | +129.7% |
| Goodwill | 62,207 | 62,261 | +0.1% |
| Operating lease right-of-use assets | 13,145 | 29,690 | +125.9% |
| Total assets | 168,361 | 261,759 | +55.5% |
Total assets grew 55.5% in a single year, and essentially all of it is physical. Net PP&E more than doubled to $99,957 million, and the filing describes this balance as "primarily servers and networking equipment with estimated useful life of six years." Goodwill was flat at $62,261 million — this was not an acquisition year. Oracle has converted itself from an asset-light licensor into a capital-intensive infrastructure operator in roughly 24 months: PP&E was $21,536 million as recently as FY2024.
The cash build to $31,289 million is not operating cash retention. It is the residue of financing: $46.1 billion of gross senior note and term loan proceeds ($39.2 billion net of $6.9 billion of repayments), $5.0 billion from preferred stock, and proceeds from the Ampere stake sale, less the $55.7 billion capital spend.
The item that does not appear in the table above matters most. The filing discloses $260 billion of additional lease commitments, "substantially all related to data center arrangements," expected to commence between the first quarter of fiscal 2027 and fiscal 2029, on terms of fifteen to nineteen years — none of it on the May 31, 2026 balance sheet. A further $19 billion of unconditional purchase commitments for cloud infrastructure assets was signed after year-end. The off-balance-sheet commitment pipeline is roughly equal to the entire on-balance-sheet asset base.
1-2. Debt Structure
Borrowings on the balance sheet reached $129,541 million from $92,568 million, an increase of $36,973 million (principal of $130,105 million less $564 million of unamortized discount and issuance costs). Against $43,056 million of total stockholders' equity ($42,508 million excluding noncontrolling interests), that is 3.01x gearing. Interest expense rose to $4,599 million from $3,578 million (+28.5%), now consuming 22.3% of operating income.
The maturity ladder is the one genuinely reassuring item here. Of the $130,105 million of principal outstanding, $22,855 million (17.6%) matures within three years while $90,250 million (69.4%) matures beyond year five. Oracle termed this debt out rather than stacking it on the front end — it does not face a refinancing wall during the construction phase.
Operating liabilities moved with the buildout rather than with sales: accounts payable more than doubled to $10,977 million from $5,113 million, and non-current deferred revenue jumped to $5,479 million from $1,346 million, consistent with the prepayments the filing says it collects "under some of our committed contracts."
1-3. Capital Structure
Oracle still carries an accumulated deficit — retained earnings of negative $4,309 million — the legacy of a decade in which buybacks exceeded cumulative earnings. It narrowed this year as $17,087 million of net income overwhelmed $5,787 million of dividends paid (including $103 million to preferred holders). Paid-in capital stands at $43,243 million against that deficit.
One new claim now sits ahead of common holders — $4,954 million of 6.50% Series D Mandatory Convertible Preferred Stock, which absorbed $103 million of dividends in its partial year. Alongside it, a $20 billion at-the-market common equity program was put in place, under which no shares had been sold as of May 31, 2026; this program will dilute existing common holders when drawn but does not rank ahead of them. Oracle has pre-positioned dilution capacity it has not yet used.
2. Consolidated Statement of Operations
2-1. Core Profitability
| Item | FY2024 ($M) | FY2025 ($M) | FY2026 ($M) | 2Y CAGR |
|---|---|---|---|---|
| Revenues | 52,961 | 57,399 | 67,357 | +12.8% |
| Operating income | 15,353 | 17,678 | 20,606 | +15.9% |
| Operating margin (%) | 29.0 | 30.8 | 30.6 | — |
| Net income | 10,467 | 12,443 | 17,087 | +27.8% |
| Net margin (%) | 19.8 | 21.7 | 25.4 | — |
| Diluted EPS ($) | 3.71 | 4.34 | 5.83 | +25.4% |
Revenue grew 17.3% and operating income 16.6% — an operating leverage ratio of 0.95x. Despite adding $10.0 billion of revenue, Oracle generated no incremental operating margin; it fell 20 basis points. That is the depreciation ramp asserting itself, and it is the single most important line in this income statement.
Net income's 37.3% jump is a different story from operating income's 16.6%, and the gap is almost entirely non-operating. Non-operating income rose $3.5 billion, from $60 million to $3,547 million, driven principally by a one-time gain on the sale of the Ampere Computing stake. Separately, the effective tax rate was 12.6%, versus the 19.9% rate Oracle itself discloses after excluding stock-based compensation, intangible amortization, restructuring, and the deferred tax remeasurement from the U.S. One, Big, Beautiful Bill Act.
Stripping the Ampere gain leaves pretax income of $16,854 million; applying Oracle's own 19.9% adjusted rate yields roughly $13.5 billion of normalized earnings against the $17,087 million reported. Roughly a fifth of headline net income came from a divestment gain and a favorable tax outcome, neither of which recurs.
2-2. Business Mix and Cost Behavior
| Cloud and Software Business | FY2025 ($M) | FY2026 ($M) | Change % |
|---|---|---|---|
| Cloud infrastructure (OCI) | 10,234 | 18,101 | +77% |
| Cloud applications | 14,272 | 15,888 | +11% |
| Software support | 19,523 | 19,804 | +1% |
| Software license | 5,201 | 4,737 | -9% |
| Total revenues | 49,230 | 58,530 | +19% |
| Cloud and software expenses | 11,569 | 17,597 | +52% |
| Sales and marketing expenses | 8,651 | 8,331 | -3.7% |
| Contribution | 29,010 | 32,602 | +12% |
| Contribution margin (%) | 59 | 56 | -3pp |
Expenses shown are GAAP operating costs as reported.
Cloud infrastructure grew 77% to $18,101 million and overtook cloud applications for the first time — OCI is now 53% of cloud revenue versus 42% a year ago. Total cloud revenue reached $33,989 million, or 51% of company revenue, up from 43%. Hardware ($3,084 million) and services ($5,743 million) remain rounding errors on the group.
The cost side is where the model is being tested. Cloud and software expenses grew 52% against 19% revenue growth, and contribution margin compressed three points. Depreciation on PP&E explains most of it: $7.6 billion in FY2026 against $3.9 billion in FY2025 and $3.1 billion in FY2024. That $3.7 billion increase accounts for roughly 61% of the $6,028 million expense increase — and it is a fixed cost that arrives on a six-year schedule regardless of utilization.
Management is visibly funding this by squeezing elsewhere. Sales and marketing fell 3% while revenue rose 19%. R&D was $10,272 million but grew only 4.2%, dropping to 15.3% of revenue from 17.2%. The declining software license line (-9%) confirms the legacy perpetual business is in managed runoff, while software support — $19,804 million, up 1% — remains the annuity that quietly funds everything else.
3. Consolidated Statement of Cash Flows
| Item | FY2025 ($M) | FY2026 ($M) | Change |
|---|---|---|---|
| Operating cash flow | 20,821 | 31,977 | +53.6% |
| Investing cash flow | (21,711) | (51,854) | — |
| Financing cash flow | 1,098 | 40,284 | — |
| Capital expenditures | (21,215) | (55,663) | +162.4% |
| Free cash flow | (394) | (23,686) | — |
| Ending cash | 10,786 | 31,289 | +190.1% |
Operating cash flow was genuinely strong at $31,977 million, up 53.6%. Operating cash flow to net income was 1.87x in FY2026, against 1.67x in FY2025 and 1.78x in FY2024 — not a consistent improvement, as the FY2025 ratio dipped below FY2024 before FY2026 rebounded. Moreover, the FY2026 figure is flattered by a new line item: $4,592 million of deferred revenue from customer prepayments with a significant financing component, nil a year earlier. Stripping this out reduces the ratio to approximately 1.60x — still above 1.0 and above FY2025, but the improvement is less dramatic than the headline implies. Receivables grew 21.3% against 17.3% revenue growth, a mild but not alarming divergence.
The problem sits one line down. Capital expenditures of $55,663 million equal 82.6% of revenue, against 37.0% in FY2025 and 13.0% in FY2024. Free cash flow was negative $23,686 million after a marginally negative FY2025 and a positive $11,807 million in FY2024. None of this is maintenance capex; it is capacity being built against contracted demand.
Financing shows how the gap was closed: $46,093 million of senior note proceeds, $4,954 million of preferred stock, $1,449 million from employee stock programs, and $3.3 billion of net short-term financing tied directly to capital expenditures. Against that, buybacks have effectively stopped — $95 million in FY2026 versus $600 million in FY2025 and $1,202 million in FY2024, an 84% year-on-year cut. Dividends, by contrast, rose to $5,787 million. Oracle chose to protect the dividend and abandon the buyback.
Stock-based compensation of $4,811 million equals 7.1% of revenue, down from 8.1% — worth tracking because Oracle's segment margin disclosures exclude it entirely.
4. Additional Analysis
The backlog is the asset, and its conversion schedule is the risk. Remaining performance obligations of $638 billion are attributed in the filing to "certain significant cloud contracts that were entered into during the period." Oracle expects to recognize approximately 12% — about $76.6 billion — over the next twelve months, 34% in months 13 to 36, 34% in months 37 to 60, and the remainder thereafter. By the filing's own breakdown, roughly half of this backlog (approximately 54%) converts more than three years out, against data center leases running fifteen to nineteen years and servers depreciating over six. The long tail of the order book stretches well beyond the useful life of the assets being deployed to serve it.
Customer concentration is disclosed selectively. No single customer accounted for 10% or more of revenues in FY2026, 2025 or 2024. But that is a revenue test, and the backlog grew by $500 billion on what the filing calls "certain significant cloud contracts" — a phrase that implies concentration in the order book that the revenue test cannot yet detect. The risk factors are explicit on the exposure: "In certain OCI offerings, we are more concentrated among a number of large customers," and Oracle warns that some customers "may be highly leveraged."
The duration mismatch is management's own stated concern. The filing states plainly that "the terms, renewal options and pricing adjustments in our long-term data center leases typically do not align with the duration and pricing of customer contracts, and if customers do not renew their contracts, we may be unable to re-lease, repurpose or assign such capacity on acceptable terms, if at all." Oracle is not hiding this exposure; it is disclosing it as a first-order risk. The investment question is whether the contracted backlog — $638 billion from counterparties Oracle itself describes as potentially "highly leveraged" — is durable enough to justify the fifteen-to-nineteen-year lease obligations being signed against it. The filing offers no direct answer. The next two fiscal years, and whether OCI's recognition rate accelerates toward the revenue line, will be the test.
This article is for informational purposes only and does not constitute investment advice or a recommendation to buy or sell any security. LineVest News is an independent publication and is not affiliated with any brokerage or investment advisory firm. All figures are sourced from Oracle Corporation's Annual Report on Form 10-K for fiscal year ended May 31, 2026, as filed with the U.S. Securities and Exchange Commission. Past performance is not indicative of future results.