Cash that isn't quite cash, $40B in IOUs, and the inventory miracle Apple built.
Quick Recap
In Part 1 we surveyed Apple's $148B in current assets at the forest level. Today we go tree by tree. Is the cash really cash? How much of the $40B in receivables won't actually be collected? Why is Apple's inventory only $5.7B?
Get this part right and you'll be able to look at almost any company's balance sheet and judge its short-term solvency in five minutes.
1. Cash — The Simplest Line, and the Most Misleading
"Cash and cash equivalents" sits at the top of every balance sheet. For Apple FY2025, the figure is $35.9B. But there's a hidden subtlety:
"Cash" on a balance sheet rarely means just bank deposits.
Under both US GAAP and IFRS, "cash equivalents" includes:
- Actual cash — bank balances and currency
- Money market funds (MMFs) — short-term funds, redeemable on demand
- Securities maturing in 3 months or less — typically Treasury bills
Apple's 10-K footnote 4 breaks down where the $35.9B actually sits:
| Component | Amount ($B) |
|---|---|
| Cash (real cash) | 28.3 |
| Money market funds | 5.3 |
| U.S. Treasuries (≤ 3 months) | 1.2 |
| Other short-term | 1.1 |
| Total cash and cash equivalents | 35.9 |
Apple FY2025 "Cash and cash equivalents" composition · Source: 10-K Note 4
Real bank cash is $28.3B. The other $7.6B is in vehicles that behave like cash because they're convertible within 90 days. The accounting standards group all of these together as "cash and cash equivalents."
"Marketable securities" — also basically cash
Right below sits "Marketable securities (short-term): $18.8B." These are bonds and securities Apple holds with maturities under one year, easily sold. Apple parks them in Treasuries, corporate bonds, and similar safe vehicles to earn a bit of interest.
Apple's true "liquid firepower" = Cash ($35.9B) + Short-term marketable securities ($18.8B) = ~$54.7B
About 11% of Korea's annual government budget, sitting in Apple's checking account equivalent.
2. Accounts Receivable — Money Earned but Not Yet Collected
Accounts Receivable for Apple FY2025: $39.8B. What is it?
Simple. "Products already sold but not yet paid for." When Apple ships iPhones in bulk to a carrier like Verizon or AT&T, those carriers don't pay on the spot — they pay 30 to 60 days later. The unpaid amount sits as a receivable until it's collected.
Are receivables good or bad?
It depends on context. Don't judge by the absolute amount alone.
- Receivables grow with revenue — that's normal.
- Receivables growing faster than revenue is a warning sign — "selling but not collecting."
- Receivables growing while revenue is flat is worse — possibly building up uncollectible accounts.
Computing Days Sales Outstanding (DSO)
DSO measures "how many days it takes, on average, to collect on a sale."
DSO = (Accounts Receivable ÷ Annual Revenue) × 365
For Apple: ($39.8B ÷ $391B) × 365 ≈ 37 days. Apple collects, on average, about 37 days after sale. That's a healthy figure for a hardware manufacturer.
By comparison, Samsung Electronics typically runs DSO around 60 days. Apple collects faster — one quiet reflection of the bargaining power Apple holds over its global retail and carrier partners.
How is the "won't pay" risk handled?
Out of $39.8B, some portion will never actually be collected. Customers go bankrupt, accounts go bad. How does accounting deal with this?
Through an Allowance for Doubtful Accounts — a contra-asset account. The $39.8B you see on the balance sheet is net of expected uncollectibles. That's why filings label it "Accounts receivable, net." The "net" matters.
Each reporting period, Apple estimates how much of the receivables won't be collectible and reserves it. Aggressive estimates can lead to surprise write-offs later; overly conservative estimates artificially depress reported earnings. The conservatism (or aggressiveness) of a company's accounting often shows up first in receivables provisioning.
3. Inventory — Apple's Two Mysteries
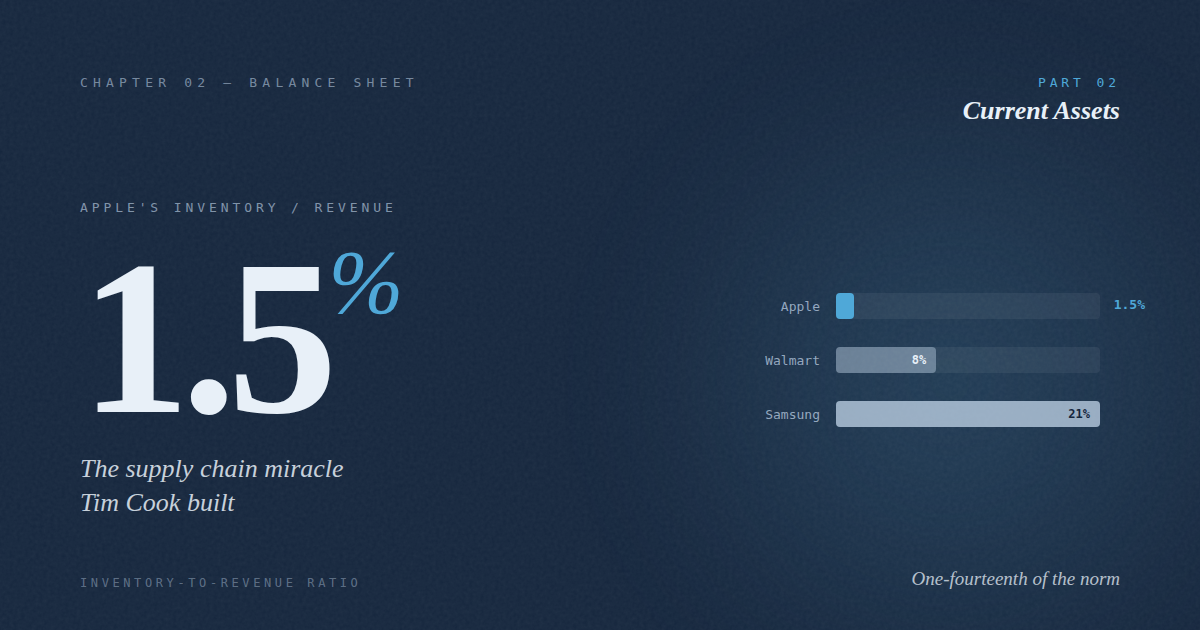
Now to the most fascinating line. Apple's inventory: $5.7B. As we saw in Part 1, that's only 1.5% of revenue — a comically small figure for a manufacturer of Apple's scale. Let's understand why.
Mystery 1: How can it be this small?
With $391B in revenue and $5.7B in inventory, Apple is holding roughly 5–6 days of sales in inventory at any moment. A typical manufacturer carries 30–60 days. Apple holds less than a week.
Three reasons make this possible:
- Just-In-Time (JIT) — Components arrive and go straight to the assembly line. Almost nothing is warehoused.
- Outsourced production — Foxconn and other contract manufacturers hold the components themselves; Apple receives them only when needed. This is the source of the "vendor non-trade receivables" line we'll discuss next.
- Narrow product line — Apple sells relatively few SKUs. Fewer SKUs mean less inventory complexity. A diversified Korean or Japanese conglomerate often runs hundreds of models simultaneously.
Mystery 2: Why did inventory shrink year-over-year?
FY2024 to FY2025: inventory dropped from $7.3B to $5.7B. Revenue grew, inventory shrank. That's a sign of either tighter demand forecasting or further supply chain efficiency gains.
When inventory grows faster than revenue, it usually means "unsold goods piling up" — a red flag. Apple is showing the opposite pattern: a healthy, well-tuned operation.
Inventory analysis principles
- Inventory rising faster than revenue is a warning sign.
- Inventory turnover (COGS ÷ Avg Inventory) speeding up means efficiency improvement.
- Always compare to industry peers (you can't compare automotive inventory to SaaS).
4. "Vendor Non-Trade Receivables" — $33B of Supply Chain Power
This line, mentioned briefly in Part 1, deserves a closer look. It rarely appears on Korean or Japanese balance sheets — it's distinctively Apple.
Vendor Non-Trade Receivables are amounts Apple is owed by component suppliers, but not from typical sales. Here's how it works:
Scenario: Apple tells supplier "X" — "Buy a million display panels for our new product. Hold them. We'll take them when we need them." Supplier X buys the panels from manufacturer "Y". Apple commits to paying X for the cost of the panels they purchased on Apple's behalf. The amount Apple is committed to settle with X for is what shows up as "vendor non-trade receivables."
Why is this an asset? From Apple's accounting perspective, it represents prepaid commitments that will eventually flow back to Apple as components. The accounting structure is unusual but is explicitly recognized under US GAAP.
The deeper insight
This $33B reveals that Apple controls vast amounts of global component inventory without tying up its own capital. Suppliers carry the inventory on their books while waiting for Apple's draw. It's why Apple's supply chain is often called the most powerful in commercial history.
5. Putting It Together — Is Apple Solvent in the Short Term?
With all current asset lines covered, let's run the diagnostic.
| Metric | Value | Read |
|---|---|---|
| Current assets | $148.0B | — |
| Current liabilities | $165.6B | — |
| Current ratio | 0.89 | Below 1.0 |
| Quick ratio* | ~0.86 | Below 1.0 |
* Quick Ratio = (Current Assets − Inventory) ÷ Current Liabilities
Current ratio of 0.89? By textbook standards, that's a red flag — it implies Apple's short-term obligations exceed its short-term assets. Yet nobody calls Apple insolvent. Why?
What Apple's low current ratio actually means
- $77.7B in long-term marketable securities — These mature beyond 12 months and are classified as non-current, but they're effectively cash. They're not in the current ratio calculation.
- Massive operating cash flow — Apple generates ~$111B in operating cash flow annually. Its capacity to settle obligations is enormous regardless of any one balance sheet ratio.
- Strategic capital efficiency — Apple's stance is essentially "why hold more cash than necessary?" Excess cash returns to shareholders via buybacks and dividends.
In summary: a current ratio of 0.89 would alarm you for most companies. For Apple it's a feature, not a bug — the byproduct of intentional capital efficiency. This kind of nuanced reading requires looking at the entire context. A single ratio in isolation almost always misleads.
6. What We Found in Part 2
- "Cash" includes more than cash — MMFs, short-term Treasuries.
- Apple's true liquid pool is ~$54.7B — about 11% of Korea's federal budget.
- DSO of 37 days — Apple collects faster than Samsung.
- Receivables are reported net of allowance for uncollectibles.
- The $5.7B inventory secret — JIT + outsourced production + SKU discipline.
- "Vendor non-trade receivables" of $33B — the accounting trace of Apple's supply chain dominance.
- A current ratio below 1.0 is normal for Apple — backed by massive cash generation.
Coming in Part 3
Part 3: Non-current assets and capital expenditures. How does "a manufacturer with no factories" still spend tens of billions on R&D and data centers? What's actually inside the $49.8B in PP&E?
We'll also unpack the $84B "other non-current assets" line — goodwill, intangibles, deferred tax assets — and reconnect with the deferred-tax concept we met in Chapter 1, this time on the asset side.
Frequently Asked Questions
Why are short-term marketable securities not included in "cash and cash equivalents"?
Cash equivalents are defined as instruments with original maturities of three months or less. Securities maturing between 3 months and 12 months are classified separately as "short-term marketable securities," even though they're highly liquid in practice.
What is a good DSO?
It varies by industry. Software (B2B SaaS) often runs DSO of 40–60 days. Hardware/consumer goods are typically 30–45 days. Distribution-heavy retailers can be under 10. The right comparison is always within an industry, and the trend matters more than the level.
Is a current ratio below 1.0 always dangerous?
Not always. For companies with very predictable cash flows and access to capital markets — like Apple — a sub-1.0 current ratio can reflect efficient capital use. For most other companies, it's a genuine concern. The key context: how reliable is the company's cash generation and how easily can it raise debt?
How does Apple's inventory compare to other tech giants?
Apple's 1.5% inventory-to-revenue is exceptional even within tech. Microsoft and Google sell digital products and run inventory near zero. Hardware peers like Dell run 5–10%. Samsung Electronics, with its memory fabs and consumer goods, sits around 21%. Apple's number reflects an unusually disciplined supply chain combined with an outsourced manufacturing model.
Next: Part 3 — Non-Current Assets and CapEx: Where the "Factoryless" Manufacturer Actually Invests.