
載入市場數據中...
2026年7月23日星期四
回到首頁Korea Stock付費專屬

Kolmar Korea (161890.KS) Q1 2026: Record ₩728B Revenue, Operating Profit Surges 32% on K-Beauty ODM Boom

作者 MinJeKim0 次瀏覽
語言:English한국어日本語繁體中文

本文的中文翻譯準備中。以下為英文原文。

Kolmar Korea (161890.KS) Q1 2026: Record ₩728B Revenue, Operating Profit Surges 32% on K-Beauty ODM Boom

Kolmask consolidation and inbound indie-brand volume drive the company's best quarter ever — but leverage is rising fast.

Source: Q1 2026 Quarterly Report — Filed April 2026 with DART | Consolidated Financial Statements | Unit: ₩ billions

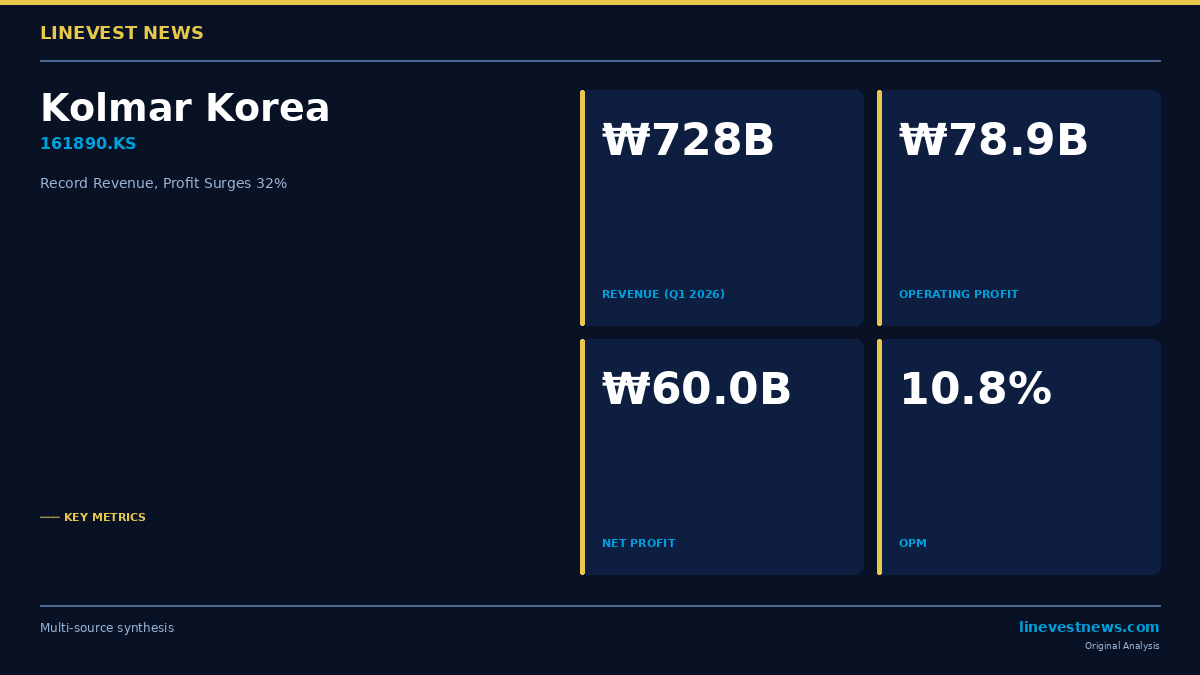
Kolmar Korea posted consolidated revenue of ₩728.0 billion in Q1 2026, its highest quarterly sales figure on record, representing 26.7% of the company's full-year 2025 revenue in a single quarter. Operating profit climbed 31.6% year-on-year to ₩78.9 billion and net income more than doubled to ₩60.0 billion (+159%), as operating leverage compressed selling, general and administrative costs even as the top line expanded by double digits. The quarter's strength flowed almost entirely from the cosmetics ODM segments, where the domestic indie-brand scaling cycle and K-Beauty export expansion converted directly into manufacturing volume. Against that backdrop, the company's debt ratio rose from 107.4% to 116.4% in just three months, driven by the January 2026 consolidation of Kolmask Co., Ltd. and a material step-up in acquisition-led fixed asset additions — a reminder that this record performance is being partly financed by leverage rather than retained capital alone.



Balance Sheet

Asset Quality and the Kolmask Effect

| Item | End-FY2025 (₩B) | End-Q1 2026 (₩B) | Change |

|---|---|---|---|

| Cash and short-term financial instruments | 313.7 | 277.9 | −11.4% |

| PP&E (net book value) | 901.8 | 972.3 | +7.8% |

| Total liabilities | 1,790.4 | 1,977.8 | +10.5% |

| Borrowings and bonds | 1,179.4 | 1,279.9 | +8.5% |

| Total equity | 1,667.3 | 1,698.6 | +1.9% |

| Debt-to-equity ratio | 107.4% | 116.4% | +9.0pp |

| Net debt ratio | 51.9% | 59.0% | +7.1pp |

PP&E expanded by ₩70.5 billion quarter-on-quarter, but the composition of that increase matters more than the headline figure. Organic capital expenditure was just ₩18.5 billion gross, largely offset by ₩18.0 billion in depreciation charges — meaning that on a purely organic basis, the fixed-asset base was essentially flat. The ₩70.5 billion net increase was almost entirely accounted for by two inorganic items: ₩17.0 billion from business combinations and ₩49.4 billion from the expansion of the consolidation perimeter (the Kolmask inclusion), with foreign exchange translation effects contributing the remaining ₩4.1 billion. The practical implication is that Kolmar Korea's apparent capital investment intensity in Q1 2026 was driven by M&A accounting, not by an accelerating organic reinvestment cycle.

Debt Structure: Financial vs. Operating Liabilities

Financial debt (borrowings plus bonds) stood at ₩1,279.9 billion at the end of Q1, representing 64.7% of total liabilities of ₩1,977.8 billion. That ratio is high by any standard and signals that interest-bearing obligations — rather than trade payables or deferred revenue — dominate the balance sheet's liability side. Operating liabilities, consisting primarily of trade accounts payable and contract liabilities, are estimated at approximately ₩695.3 billion on the residual basis.

Currency swap fair value liabilities increased from ₩1.8 billion to ₩2.6 billion over the quarter, reflecting approximately ₩640 million in unrealised mark-to-market losses as hedging positions on the won/dollar axis repriced. With four overseas subsidiaries now operational — HK Kolmar (Wuxi), HK Kolmar (Huzhou), HK Kolmar USA, and HK Kolmar Canada — and Kolmar UX and Kolmask newly within the consolidation perimeter, the company's aggregate foreign-currency revenue exposure has expanded materially. Overseas sales reached ₩66.8 billion (9.2% of consolidated revenue) in Q1 2026, and hedging costs will continue to rise in line with that exposure.

Capital Structure

Total equity grew by a modest ₩31.3 billion (+1.9%) to ₩1,698.6 billion, principally through the retention of quarterly earnings. The asymmetry between equity growth (+1.9%) and liability growth (+10.5%) — a ratio of roughly one-to-five — marks a shift in the company's financing posture from equity-led to debt-led growth. Sequential consolidations of Kolmar UX in 2025 (₩7.2 billion consideration) and Kolmask in January 2026 (₩20.4 billion) reflect an ongoing intra-group reorganisation under parent Kolmar Holdings, with capital reallocation likely to continue through 2026.

無限閱讀企業分析 — 每月$9.99

Kolmar Korea (161890.KS) Q1 2026: Record ₩728B Revenue, Operating Profit Surges 32% on K-Beauty ODM Boom

本文於2026年7月12日發布。訂閱即可立即閱讀全文,2026年10月10日之後將免費開放。

隨時可取消 · 7天內全額退款

深入標題背後

您剛讀到發生了什麼。接下來,讀懂它意味著什麼。

免費每日簡報

每天早晨的韓國市場 — 免費

LineVest Daily在首爾開盤前送達您的信箱:KOSPI與KOSDAQ關鍵報導、財報、披露與外資流向 — 以簡明英文呈現。免費,無需信用卡。

免費獲取LineVest Daily →
這家公司

Kolmar Korea完整報告

我們完整閱讀Kolmar Korea的最新DART披露 — K-IFRS財務、公司治理,以及對股價的意義。3小時內PDF送達您的信箱。

$12 · 單次

獲取Kolmar Korea報告
所有您關注的股票

掌握整個市場

每週研究多檔韓股?所有分析文章發布即讀 — 每日KOSPI與KOSDAQ完整報導加90天檔案庫。

$9.99 · 每月

訂閱

基於DART原始披露的獨立新聞報導 — 非投資建議。與任何券商無關。







