A beginner's guide to the top line — explained through Samsung Electronics' 2025 filing
Why This Series Exists
Most people who try to read a financial statement give up within five minutes. The numbers are huge. The rows are dense. The language feels designed to exclude you. I know because I've been there.
This series fixes that. We'll read one line of the income statement at a time, in plain English, and we'll do it with a real company you've heard of: Samsung Electronics. Yes, Samsung is a Korean company, and their filings use a slightly different accounting framework (K-IFRS) than US GAAP. But the core is the same. If you can read Samsung's income statement, you can read Apple's. I promise.
Today: the very top line — Revenue.
1. What Is Revenue, Really?
Revenue is "all the money a company collected from customers during the year." That's it. No subtractions yet. Just the total cash (or promises of cash) coming in from selling products and services.
You'll hear revenue called "the top line" because it sits at the very top of the income statement. Everything else on the page is subtracted from this number.
Think of a bakery. Revenue is the total the bakery rang up at the register all year — before the baker paid for flour, rent, or their assistant's wages. It's a measure of the bakery's scale, not its profit.
A bigger revenue number doesn't mean a better company. A $10B retailer on razor-thin margins may hand less money to shareholders than a $1B software company. Revenue tells you how much was sold — not how much was kept.
That's why revenue is the starting point, not the conclusion. Plenty of companies post huge revenue and still lose money. We'll need to walk down the income statement — through cost of goods sold, operating expenses, taxes — before we know the real story.
2. Samsung's Top Line: $243 Billion
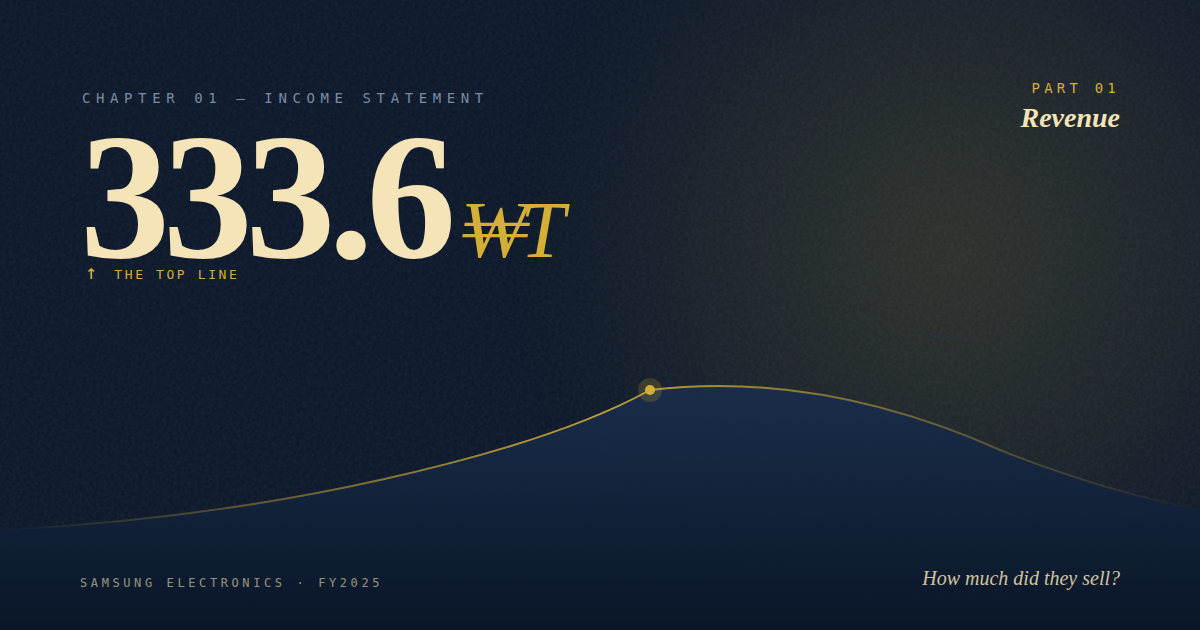
Samsung Electronics reported ₩333.6 trillion in consolidated revenue for fiscal year 2025. At recent exchange rates (~₩1,370 per USD), that's roughly $243 billion.
To give that number context:
- Apple: $391B in FY2024
- Microsoft: $245B in FY2024
- TSMC: ~$90B in FY2024
So Samsung sits in the same neighborhood as Microsoft, and does about 60% of Apple's volume. It's a global top-tier business by any measure.
Looking at three years side by side gives us even more information.
| Fiscal Year | Revenue (₩ trillion) | YoY Growth |
|---|---|---|
| FY2023 | 258.9 | — |
| FY2024 | 300.9 | +16.2% |
| FY2025 | 333.6 | +10.9% |
Source: Samsung Electronics Annual Business Report (연결 손익계산서)
At a glance, it looks like clean growth. But behind those three numbers is the memory chip cycle — and if you understand nothing else about Samsung, understand this:
FY2023 was the bottom of a brutal memory-chip downturn. Oversupply crushed prices. Samsung's semiconductor business barely broke even. Then AI demand exploded in 2024–2025, memory prices snapped back, and the same factories started printing money again. Revenue followed.
So revenue alone — just one line — already told us something crucial: this is a cyclical business. You cannot evaluate Samsung the way you'd evaluate, say, Costco. A cyclical company's revenue today doesn't predict revenue next year. You have to ask: where are we in the cycle?
3. What Are They Selling? — Product Breakdown
Don't stop at the top line. A single revenue number hides what's actually driving the business. Samsung's annual report breaks revenue down by product line (similar to the Segment Reporting section you'd find in a US 10-K).
| Product Segment | FY2023 | FY2024 | FY2025 |
|---|---|---|---|
| Smartphones, etc. | 108.6 | 114.4 | 126.5 |
| Memory semiconductors | 44.1 | 84.5 | 104.1 |
| TVs, monitors, etc. | 30.4 | 30.9 | 30.9 |
| Display panels | 31.0 | 29.2 | 29.8 |
Unit: ₩ trillion. Includes intra-group transactions.
Smartphones are still Samsung's biggest product category. But look at memory: it grew from ₩44T in 2023 to ₩104T in 2025 — more than 2.3× in two years. Meanwhile TVs and displays stayed flat.
That one comparison tells us almost all of Samsung's revenue growth came from memory chips. Not smartphones. Not appliances. Memory.
If you own Samsung stock and think of it as "the phone company," this table should change your mind. Samsung's fate is now tied to DRAM and NAND pricing — which is why Samsung's stock often moves in step with Micron, SK Hynix, and even NVIDIA. They're all plugged into the same AI-driven memory cycle.
Takeaway: Never treat revenue as a single number. Break it down. The breakdown often reveals a different company than the brand image suggests.
4. Where Are They Selling It? — Geographic Breakdown
Revenue can also be split by geography. This matters more than most investors realize.
| Region | Revenue (₩ trillion) |
|---|---|
| China | 71.6 |
| Americas | 67.9 |
| Asia & Africa | 45.7 |
| Europe | 31.2 |
| South Korea (domestic) | 21.7 |
Standalone basis (non-consolidated), FY2025
Domestic sales: ₩21.7T. Overseas sales: roughly ₩216T. That means over 90% of Samsung's revenue comes from outside Korea. Apple is international too (~60% overseas), but Samsung is on another level. This is actually typical of large Korean companies — Korea's domestic market is small, so any company that wants to grow has to export.
Here's the important consequence: those overseas sales come in as US dollars, euros, yuan, and other foreign currencies. But Samsung's books are kept in Korean won. So every time the won/dollar exchange rate moves, Samsung's reported revenue and profit move with it — even if nothing changed in the real business.
This is a recurring theme for Korean stocks: FX exposure is baked in. US investors are used to thinking about FX only for specific multinationals. For most Korean blue-chips, it's constant. We'll revisit this when we get to Non-Operating Income.
5. What Revenue Opens Up
Let's lock in what we just learned. When you see a revenue figure, ask three questions:
How much? — the scale.
What? — the product mix.
Where? — the geographic mix.
Applied to Samsung FY2025, those three questions gave us a surprisingly full portrait: a ₩333T cyclical business riding the memory recovery, powered mostly by smartphones and chips, earning over 90% of its money abroad. All from one line on the income statement, read properly.
But we still only know how much Samsung collected. We don't yet know how much it cost them to collect it. That's the next line down — Cost of Goods Sold — and it's where we start seeing whether this revenue actually turns into profit.
See you in Part 2.
Frequently Asked Questions
What is revenue on an income statement?
Revenue is the total money a company collected from selling its products and services during a reporting period, before any costs are subtracted. It's sometimes called "sales" or "the top line."
Is revenue the same as profit?
No. Revenue is total sales; profit is what's left after all costs. A company can have huge revenue and still lose money. That's why walking down the income statement line by line matters.
Why do Korean companies use K-IFRS instead of US GAAP?
K-IFRS is Korea's adoption of International Financial Reporting Standards (IFRS), which is used in most major markets outside the US. The core concepts match US GAAP very closely — the main differences show up in specific areas like revenue recognition timing and how certain leases or financial instruments are presented.
Where can I find Samsung's financial filings?
Samsung's annual business reports (사업보고서) are available free on DART (dart.fss.or.kr), Korea's version of the SEC's EDGAR system. English-language summaries are also published on Samsung's investor relations page.
Next in this series: Part 2 — Cost of Goods Sold (COGS): How Much Did It Actually Cost?