The ₩43 trillion expense that doesn't actually cost Samsung anything this year
Why This Bonus Chapter Exists
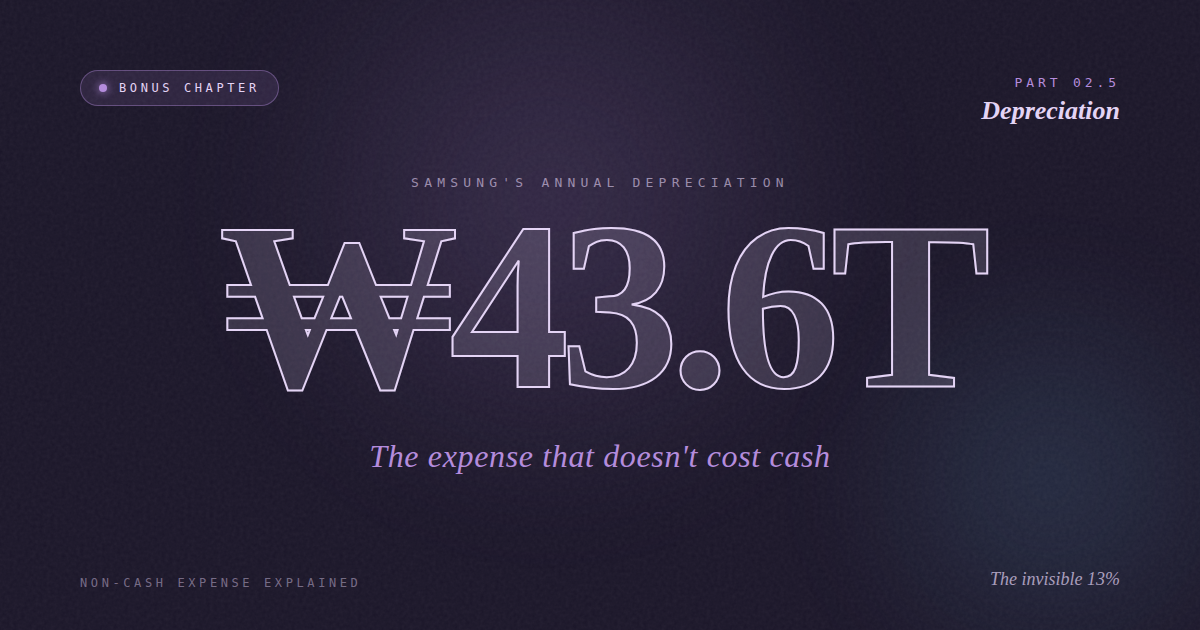
In Part 2 we met a strange number: Samsung's depreciation of ₩43.6 trillion in FY2025 — roughly 15% of all costs. I mentioned it, used it, and moved on.
But "depreciation" is a word you'll see everywhere going forward. In the income statement. In the cash flow statement. In the balance sheet. In the footnotes. Without really understanding what it is, every chapter from here will quietly confuse you.
So today is a short pause. One concept, deeply understood. Get this right, and every financial statement you read for the rest of your life becomes dramatically easier.
1. What Is Depreciation?
Depreciation is "the accounting rule that spreads the cost of an expensive asset across the years it's used, instead of counting it all as an expense in the year you bought it."
Back to the bakery. Suppose the owner buys a $100,000 oven that will last 10 years. How should that $100,000 show up on the income statement?
There are two intuitive options:
A) Expense all $100,000 in year 1 — giant loss in year 1, zero cost for years 2–10.
B) Expense $10,000 per year for 10 years — steady, balanced cost that matches when the oven is actually generating revenue.
Accounting uses Option B. This is depreciation. The oven earns revenue across 10 years, so its cost should be matched to those 10 years. This rule is called the matching principle — it's one of the foundations of accrual accounting.
The word depreciation is used for tangible assets (buildings, machinery). For intangibles (patents, software), the equivalent word is amortization. Same concept, different name.
2. The Critical Feature: "Depreciation Doesn't Consume Cash"
Here's the single most important thing to remember about depreciation.
When the bakery buys the oven, $100,000 leaves the bank account immediately. That's real cash out the door.
But on the income statement? Only $10,000 gets recognized as an expense that year. Another $10,000 the next year. And the next.
So from year 2 onward, something remarkable happens. The income statement shows $10,000 of expense each year — but no cash actually leaves the bank. The money was already gone in year 1. The yearly $10,000 charge is a pure accounting entry.
Depreciation is a "non-cash expense." It reduces reported profit, but no cash actually leaves the business when it's recognized. This is where "accounting profit" and "real cash" start to diverge — a gap that becomes critical when we get to the cash flow statement.
3. How Is Depreciation Calculated?
Several methods exist, but one dominates in practice: straight-line depreciation. It does exactly what the name suggests — the same amount of expense every year.
The formula:
Annual depreciation = (Cost − Salvage value) ÷ Useful life
• Cost: what you paid for the asset
• Salvage value: expected resale value at the end of its useful life (often assumed near zero)
• Useful life: how many years the asset is expected to be productive
For our oven: ($100,000 − $0) ÷ 10 years = $10,000 per year. Simple.
Useful lives vary by asset type. Typically: buildings 20–40 years, machinery 5–10 years, vehicles 4–6 years, software 3–5 years. Both US GAAP and K-IFRS require companies to disclose their useful life assumptions in the footnotes of their annual report.
4. Why It Matters — Wildly Different Depreciation Weights by Industry
The size of depreciation varies massively by business model and industry. This matters because two companies with the same operating margin can be radically different businesses depending on how much depreciation they carry.
| Industry | Depreciation as % of Revenue |
|---|---|
| SaaS / Software | ~2–4% |
| Platforms (Google, Meta) | ~5–10% |
| Consumer goods (P&G, Coca-Cola) | ~3–5% |
| Semiconductors (Samsung, TSMC) | ~10–15% |
| Airlines (Delta, United) | ~8–12% |
Approximate industry averages
Why the enormous spread? It comes down to how much physical capital a business needs. A software company needs laptops and cloud servers. A semiconductor company needs tens of billions of dollars of fab equipment. The depreciation line follows accordingly.
Samsung's ₩43.6T depreciation in FY2025 is roughly 13% of revenue — right in the middle of the semiconductor industry band. That one number alone tells you Samsung is a capital-intensive business that sinks enormous amounts into physical facilities.
5. Three Things You Can See Once You Understand Depreciation
With the concept locked in, three powerful insights open up automatically.
① Low operating income doesn't mean a weak company
Because depreciation doesn't consume cash, two companies with the same operating income can hold very different amounts of actual cash. A software company with $10B in operating income and a semiconductor company with $10B in operating income are producing qualitatively different cash piles. The chip maker's reported profit is depressed by depreciation that never actually left the company.
② This is why EBITDA exists
You've probably seen the word EBITDA in investment news. It stands for Earnings Before Interest, Taxes, Depreciation, and Amortization — essentially, operating income with depreciation added back.
Why bother adding it back? Because depreciation levels vary so dramatically across industries that it becomes hard to compare companies apples-to-apples. EBITDA strips that difference out to show how much cash the core business is actually throwing off. Samsung's FY2025 EBITDA was roughly ₩43.6T operating income + ₩43.6T depreciation = about ₩87T. Almost 2× operating income.
③ Why Amazon survived years of "losses"
Amazon famously reported near-zero operating profit for most of the 2000s. Observers kept asking: "How is this company not going bankrupt?" The answer: its massive depreciation from warehouses and servers crushed reported profit, but cash kept pouring in. Accounting profit ≠ cash profit. That gap — invisible to investors who didn't understand depreciation — was where Amazon's survival (and eventual dominance) hid in plain sight.
Going forward, always look at operating income alongside depreciation. Together, the two numbers reveal how capital-intensive a business is, and how much of a gap exists between its reported earnings and its real cash generation.
6. Back to the Main Story
Now that depreciation is clear, we can return to Chapter 1's main thread with sharper vision.
The fact that Samsung's FY2025 COGS contains ₩43T of depreciation, that most of it comes from its semiconductor fabs, and that this number barely moves as revenue grows or shrinks — all of this should feel much more intuitive now.
And wait until we reach Chapter 3 (the Cash Flow Statement). You'll see that Samsung's operating cash flow is far larger than its net income. The reason is precisely this ₩43T depreciation, being added back as a non-cash expense. The same principle you just learned, playing out one statement over.
Now, onward to Part 3: SG&A and Operating Income. Let's figure out where the ₩88 trillion between gross profit and operating income actually went.
Frequently Asked Questions
Is depreciation a real expense?
It's a real expense in the accounting sense — the asset really does lose value as it's used. But it's a non-cash expense because no cash leaves the company in the year depreciation is recognized. The cash already left when the asset was purchased, possibly years earlier.
What's the difference between depreciation and amortization?
They're the same concept applied to different asset types. Depreciation applies to tangible assets (buildings, machinery, vehicles). Amortization applies to intangible assets (patents, software, goodwill, acquired customer relationships). Both spread an asset's cost across its useful life.
Why do companies use straight-line depreciation instead of other methods?
It's the simplest and most comparable across companies. Other methods (declining balance, units of production) can better match specific assets but introduce complexity. Both US GAAP and IFRS permit alternatives, but straight-line dominates for most property, plant, and equipment.
Should I use EBITDA or operating income when comparing companies?
Depends on the comparison. For companies in the same industry with similar capital intensity, operating income is fine. For cross-industry comparisons, or for leverage analysis, EBITDA removes the distortion from different depreciation levels. But be cautious — EBITDA ignores very real capital reinvestment needs, so it can flatter heavily capital-intensive businesses.
Next: Part 3 — SG&A and Operating Income: Where Samsung Spends ₩88 Trillion.