市場データを読み込み中...
2026年7月24日金曜日
ホームへ戻るNews

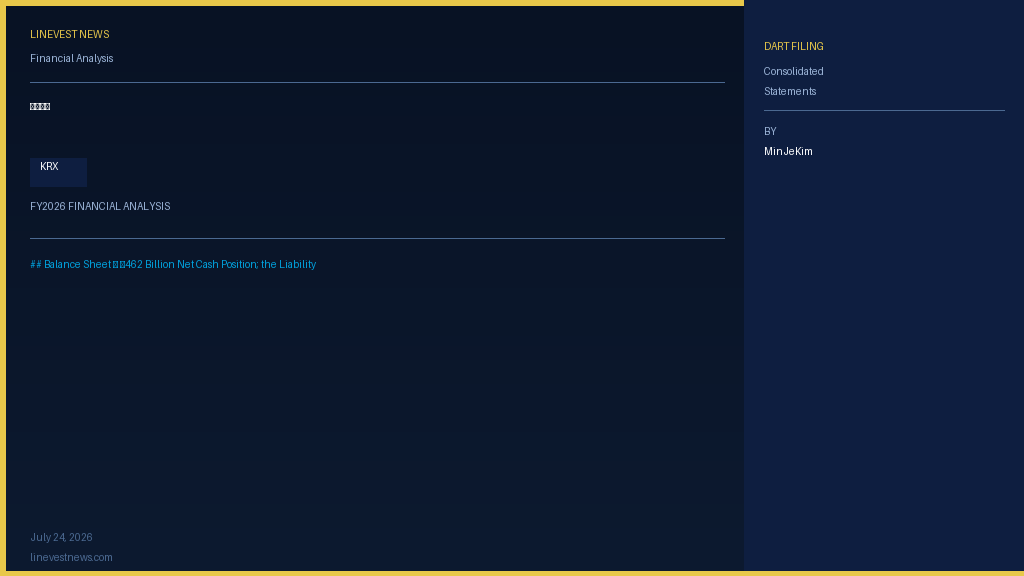
Lino Industrial (058470.KQ) Q1 2026: Net Profit Surges 38% as AI-Driven Test Demand Anchors 47% Operating Margin

執筆 MinJeKim0 回閲覧

この記事の日本語訳は準備中です。以下は英語の原文です。

Lino Industrial (058470.KQ) Q1 2026: Net Profit Surges 38% as AI-Driven Test Demand Anchors 47% Operating Margin

Lino Industrial (058470.KQ) Q1 2026: Net Profit Surges 38% as AI-Driven Test Demand Anchors 47% Operating Margin

A 27% revenue jump converted at 1.3× operating leverage confirms that Lino's near-half-century socket margins are structural, not cyclical — and that AI test complexity has durably reset the demand floor.

Source: Q1 2026 Quarterly Report (31st Fiscal Year, January 1 – March 31, 2026) — Filed May 14, 2026 with DART | Standalone Financial Statements (no consolidated statements required; Lino Industrial operates with zero subsidiaries per disclosure notes) | Unit: ₩ billions


Lino Industrial delivered Q1 2026 revenue of ₩99.8 billion, a 27.2% year-on-year increase, while operating profit surged 35.4% to ₩47.3 billion and net income jumped 37.7% to ₩40.4 billion — producing an operating margin of 47.4% and a net margin of 40.5% that place it among the most profitably managed component manufacturers in the Korean market. The leverage signature embedded in the quarter is as telling as the absolute figures: selling and administrative expenses rose only 9.9% against a 27.2% revenue increase, confirming that Lino's fixed-cost structure converts incremental revenue almost entirely into operating profit once base costs are covered. Annualizing the Q1 run rate implies a full-year trajectory approaching ₩400 billion, compared to ₩372.5 billion for the entirety of FY2025 — suggesting sequential momentum has not plateaued and that the company has moved from recovery into genuine expansion. Anchoring all of this is a balance sheet carrying ₩462 billion in combined cash and liquid financial assets against a lease liability of under ₩0.2 billion, making Lino one of the most financially self-sufficient capital-goods companies on the KOSDAQ.


Balance Sheet — ₩462 Billion Net Cash Position; the Liability Surge Is a Dividend-Declaration Artifact

Asset Composition

ItemEnd-2025 (₩B)End-Q1 2026 (₩B)Change
Cash and cash equivalents85.271.8−15.7%
Trade receivables52.967.6+28.0%
Inventories15.518.3+18.0%
Other financial assets (current)370.0390.0+5.4%
Property, plant and equipment228.0242.7+6.5%
Intangible assets1.91.8−2.4%
Total assets791.9832.0+5.1%

The balance sheet's most important feature is almost invisible in a standard ratio analysis. Cash and cash equivalents of ₩71.8 billion represents only 8.6% of total assets — but add the ₩390.0 billion in current financial assets, predominantly short-duration investment instruments, and the immediately accessible pool totals ₩461.8 billion. Including ₩19.2 billion in non-current financial assets brings the aggregate cash-equivalent position above ₩480 billion, representing more than 57% of the ₩832.0 billion total asset base. This is accumulated earnings that management has chosen not to deploy into plant or acquisitions, instead holding it in investment instruments — a deliberate posture that provides both strategic optionality and a growing stream of recurring investment income. The modest 15.7% decline in headline cash reflects reallocation into short-term financial instruments rather than any net cash consumption.

Trade receivables expanded from ₩52.9 billion to ₩67.6 billion, a 28.0% increase that tracks nearly precisely with the 27.2% revenue growth. Credit quality shows no signs of strain: the allowance for doubtful accounts has held at ₩116 million — an effective impairment rate below 0.2% — unchanged across three consecutive fiscal years. Inventory grew 18.0% to ₩18.3 billion. In a standard manufacturer, a slower inventory build relative to revenue growth might signal tightening lead times or lean channel restocking; here it reflects the operating model. Approximately 30,000 distinct socket specifications are produced entirely to customer order, with lead times of 10 days to four weeks from receipt of specification. The company notes explicitly in its filing that aged or slow-moving inventory does not accumulate under this custom-manufacturing structure, and the numbers bear that out.

Property, plant and equipment rose from ₩228.0 billion to ₩242.7 billion, driven by ongoing factory construction spending. The land acquisition from K-water in 2022 — an industrial park parcel with a total discounted payment of ₩74.5 billion, now fully settled — forms the foundation for a new production facility being built and capitalized as construction-in-progress. No debt has been raised for this project; the entire investment is financed from accumulated internal cash.

Liability Structure — The Optical Illusion

Total liabilities nearly doubled from ₩60.7 billion at year-end 2025 to ₩121.2 billion at March 31, 2026 — a figure that demands immediate decomposition. Other payables within current liabilities jumped from ₩7.4 billion to ₩77.4 billion, an approximately tenfold increase, driven almost entirely by the board's formal resolution to pay the FY2025 annual dividend of ₩60.7 billion. Under K-IFRS, once a dividend is formally declared the obligation is reclassified from retained earnings and recognized as a payable on the balance sheet, even if no cash has yet been disbursed. The actual payment is scheduled for Q2 2026. The cash flow statement confirms this mechanically: financing activities in Q1 recorded only ₩0.025 billion in lease repayments, with zero dividend cash outflow. Beyond this timing artifact, financial debt consists of ₩0.19 billion in lease liabilities — immaterial by any measure. The headline debt-to-equity ratio of 17.0% (₩121.2 billion / ₩710.9 billion) will revert toward single digits once the dividend clears in Q2, making the Q1 leverage metrics an artifact of accounting mechanics rather than any structural change in capital policy.

Equity — Dividend Commitment Exceeds One Quarter's Earnings

Total equity declined 2.8% from ₩731.2 billion to ₩710.9 billion. Retained earnings fell from ₩720.4 billion to ₩700.0 billion: Q1 net income of ₩40.4 billion was added to the ledger, but the ₩60.7 billion dividend declaration exceeded it by ₩20.3 billion, producing the net drawdown. Paid-in capital — ₩7.6 billion in share capital plus ₩5.6 billion in capital surplus — has remained absolutely static across three fiscal years, confirming that virtually the entire ₩710.9 billion equity base, over 99%, consists of accumulated retained profits rather than contributed capital. Treasury shares of 316,250 units are recorded as a capital adjustment of −₩2.4 billion.


Income Statement — The Fixed-Cost Leverage Engine Behind a 47% Margin

Core Profitability Metrics

ItemFY2024 (₩B)FY2025 (₩B)Q1 2026 (₩B)
Revenue278.2372.599.8
Operating profit124.2177.047.3
Operating margin (%)44.647.547.4
Net income113.3152.040.4
Net margin (%)40.740.840.5
EPS (₩)1,4932,002532

Reading the income statement as a one-quarter snapshot misrepresents the business, because Lino operates within a semiconductor demand cycle that rewards a multi-year lens. FY2024 was the recovery year following the 2023 memory downturn, with revenue of ₩278.2 billion. FY2025 saw revenue accelerate 33.9% and operating profit surge 42.5%, marking the transition from trough recovery to cycle expansion. Q1 2026's ₩99.8 billion, annualized, implies a ₩400 billion trajectory — not a seasonal spike but a sustained upshift in the demand baseline. Margins across this entire arc have been remarkably stable: the operating margin has ranged from 44.6% to 47.5%, and the net margin has held in an almost perfectly flat band between 40.5% and 40.8%, regardless of where revenue sits in the cycle.

Margin Architecture and the Fixed-Cost Engine

The mechanics of Q1's margin deserve granular analysis. Gross profit expanded from ₩38.8 billion to ₩51.5 billion, a 32.8% increase, while the gross margin improved from 49.4% to 51.6%. The remaining step from gross profit to operating profit is remarkably thin: selling and administrative expenses rose only ₩0.4 billion, from ₩3.8 billion to ₩4.2 billion, a 9.9% increase against a 27.2% revenue base. SG&A as a proportion of revenue consequently fell from 4.9% to 4.2%. The result is operating leverage of approximately 1.3 times: a one-percentage-point increase in revenue growth translated into 1.3 percentage points of additional operating profit growth. This is not coincidence — it is the arithmetic consequence of a business where the dominant costs are precision manufacturing infrastructure and skilled machining labor, both largely fixed over a quarterly horizon.

The mechanism deserves a structural explanation. Lino's competitive position is rooted in its fully vertically integrated front-end manufacturing process — precision machining of the socket body and probe pin fabrication are both performed in-house, a level of integration rare among component suppliers of this scale. This integration gives Lino cost visibility and quality control that competitors relying on outside machining cannot replicate. Once the fixed-cost base of this infrastructure is covered, each additional ₩1 of revenue generates disproportionately higher marginal profit than it would at a less integrated peer. Pricing power reinforces the structure further: because each new chip architecture — advanced packaging, HBM stacks, chiplet configurations — requires freshly engineered sockets with minimal design carryover, Lino negotiates each new program largely from scratch rather than competing on price continuity against an established schedule.

Below-the-Line Income Quality

The non-operating contribution adds another dimension to earnings quality. Net other income reached ₩5.8 billion in Q1 2026, more than doubling from ₩3.1 billion in Q1 2025. The composition is two-part: financial income of ₩2.7 billion generated by the ₩460-plus billion cash and financial asset pool, against financial expenses of less than ₩0.1 million — effectively zero — and net exchange-related other income of ₩3.2 billion (gross other income of ₩5.9 billion less other expenses of ₩2.7 billion). This is a company earning investment income at a scale comparable to a small financial institution while carrying no meaningful interest-bearing liabilities. Pre-tax income grew 39.8%, from ₩38.0 billion to ₩53.1 billion. After an effective tax rate of approximately 24%, net income reached ₩40.4 billion, sustaining a net margin of 40.5% — virtually identical to the 40.7% and 40.8% of the preceding two full fiscal years. The extraordinary stability of this metric across varying revenue levels indicates that the margin is not a product of favorable one-time items but of a business model with consistent, structural after-tax conversion characteristics.


Cash Flow — Operating Cash Contracts Despite Earnings Growth; CapEx Reflects New Factory Progress

ItemQ1 2025 (₩B)Q1 2026 (₩B)Change
Operating cash flow48.420.0−58.6%
Investing cash flow−16.1−35.4wider outflow
Financing cash flow−0.03−0.03
Closing cash86.971.8

The Earnings-to-Cash Divergence

Net income grew 37.7%, yet operating cash flow fell 58.6%, from ₩48.4 billion to ₩20.0 billion. The earnings quality ratio — operating cash flow as a proportion of net income — collapsed from 1.65 to 0.50, a deterioration striking enough to require systematic explanation. Three identifiable factors account for the gap in full. Trade receivables consumed ₩14.8 billion in working capital as the revenue surge produced a proportional increase in outstanding billings. Inventory absorbed a further ₩2.8 billion. Most significantly, income taxes paid increased from ₩8.2 billion to ₩13.0 billion — a ₩4.9 billion rise tied directly to the settlement of FY2025's higher tax liability on record annual earnings. Together, these three items account for approximately ₩22.5 billion of additional cash outflow relative to Q1 2025, which maps directly onto the ₩28.4 billion earnings-to-cash shortfall.

All three are time-dependent effects rather than structural impairment of cash conversion. Receivables from Q1 revenue will be collected in Q2 on the company's normal billing terms. Inventory will normalize as the production and order cycle turns. Tax payments are inherently lumpy on a quarterly basis and should not repeat at this scale in subsequent quarters. This is a seasonal cash pattern common in export-oriented manufacturers during revenue-growth quarters — not a signal of deteriorating collection quality. Nonetheless, the earnings quality ratio merits monitoring through Q2 and Q3 to confirm that receivables Days Sales Outstanding remains within historical ranges.

Capital Expenditures and Free Cash Flow

Capital expenditure rose from ₩16.7 billion to ₩18.0 billion, representing approximately 18% of Q1 revenue — a level consistent with the active phase of the new factory construction project. The investment is being executed entirely from internal resources, consistent with Lino's practice of funding all capital needs from accumulated cash without recourse to external financing. Free cash flow (operating cash flow minus capital expenditure) compressed sharply from ₩31.7 billion to ₩2.1 billion, reflecting the confluence of the seasonal operating cash contraction and elevated CapEx. As the working capital cycle normalizes in subsequent quarters and the new facility approaches completion, free cash flow should recover toward the levels that have historically supported both the annual dividend and continued cash accumulation simultaneously.

Financing activities remain a rounding-error item: ₩0.025 billion in lease repayments. The ₩60.7 billion dividend, declared in Q1 and booked as a balance sheet payable, will appear as a cash outflow in the Q2 financing section — a timing distinction that investors tracking cash return on capital should carry forward into their Q2 analysis.


Key Findings

Export Concentration and Currency Dynamics

Exports accounted for 79.2% of Q1 2026 revenue (₩79.1 billion), consistent with the 79.8% share in FY2025 and 77.2% in FY2024. This concentration is a permanent structural feature rather than a temporary mix shift: Lino's end customers include semiconductor manufacturers and test and assembly houses across the United States, Taiwan, Japan, and Southeast Asia, all of whom transact in foreign currency. The company explains that a partial natural hedge exists — foreign-currency socket revenue and foreign-currency raw-material procurement partially offset each other in both timing and magnitude, dampening the net open exposure. That said, a rapid and sustained appreciation of the Korean won, particularly against the US dollar, would compress won-denominated revenue and margin when translated back, even if the underlying socket economics were unchanged. The company's risk disclosures acknowledge this directional sensitivity without providing quantitative scenario ranges, which is a gap that institutional investors building sensitivity models will need to bridge independently.

Product Mix and the AI Test Demand Signal

Semiconductor products account for 88.8% of Q1 revenue: IC test sockets at 64.1% and Leeno Pin spring-probe components at 24.7%. Medical device components make up the remaining 11.2%. The IC test socket segment has been the primary growth driver — annual revenue from this category expanded from ₩171.8 billion in FY2024 to ₩243.9 billion in FY2025, a 41.9% single-year increase — and the Q1 2026 trajectory suggests that momentum has carried into the new fiscal year.

The underlying driver is test complexity, not simply test volume. AI accelerator chips, HBM memory stacks, and chiplet-based package configurations impose substantially higher demands on the test socket: more pins, tighter mechanical tolerances, shorter qualification windows, and reduced usable life per socket set. Each new chip generation requires freshly engineered sockets with limited design carryover from prior architectures, which means Lino prices new programs on cost-plus or value terms rather than against established competitive price sheets. This dynamic is materially different from a commodity consumable business where switching costs are low and pricing is constrained by alternatives. The World Semiconductor Trade Statistics body projected global semiconductor market growth of approximately 22% in 2025 and 26.3% in 2026 (autumn 2025 forecast), providing a macro tailwind that aligns with Lino's backlog composition. Lino's customer base spans integrated device manufacturers, fabless designers, foundries, and outsourced semiconductor assembly and test providers — a breadth that structurally reduces dependence on any single customer segment or memory product cycle relative to a socket supplier with narrower market coverage.

R&D Intensity — Expensed in Full, No Capitalization Distortion

Research and development expenditure as a proportion of revenue has been consistent and material: 3.61% in FY2024, 3.52% in FY2025, and 3.33% in Q1 2026. All R&D spending is charged to expense as incurred. The intangible asset balance is actually declining slightly (from ₩1.9 billion to ₩1.8 billion), providing direct confirmation that Lino does not capitalize development costs to inflate reported earnings. This is a meaningful disclosure quality point. K-IFRS IAS 38 permits capitalization of development-phase costs once technical feasibility has been established, and some Korean technology companies apply this provision aggressively to convert what would otherwise be income statement charges into balance sheet assets. Lino's approach eliminates this source of potential earnings inflation entirely, making its reported margins a more reliable representation of the economic performance of the business rather than a reflection of accounting choices.

Contingent Liabilities and Audit Standing

Lino has provided no payment guarantees and offers no collateral on behalf of third parties as of March 31, 2026. The company reports no pending litigation and no material contingent liabilities. The external auditor issued an unmodified opinion. The Key Audit Matter designated in the audit report — revenue recognition on export sales — is a routine selection for a manufacturer with a high export ratio, not an indicator of any identified irregularity. There is no history of financial restatement.

Capital Allocation: Fortress Balance Sheet, Self-Funded Growth, and a 40% Payout

Lino's capital allocation framework has been internally consistent across at least three fiscal years: maintain a net cash position sufficient to self-fund any foreseeable capital project without external financing; sustain a dividend payout of approximately 40% of annual net income; avoid financial debt entirely. The FY2025 dividend of ₩60.7 billion, resolved in Q1 2026, corresponds to a 39.96% payout ratio on FY2025 net income of ₩152.0 billion — the third consecutive year at approximately this level. With nearly ₩480 billion in total cash and liquid financial assets on the balance sheet, the company's theoretical capacity for extraordinary shareholder returns — special dividends, accelerated buybacks — is substantial. Nothing in the current filing signals an intention to deploy this capacity beyond the ongoing factory construction and the regular annual dividend. The factory investment, while not trivial in absolute terms (CapEx is running at approximately ₩70 billion annualized), is fully covered by operating cash generation at current profitability levels, leaving the cash fortress largely intact.


Outlook

Lino enters the remainder of 2026 in expansion-phase dynamics, not recovery. The annualized Q1 revenue run rate of approximately ₩400 billion exceeds the full-year FY2025 result of ₩372.5 billion, and the operating margin at 47.4% is within a fraction of FY2025's 47.5% — implying that neither demand deceleration nor margin compression is yet visible in the most recent data.

The structural bull case rests on three durable pillars. The transition toward AI accelerators, advanced packaging, and HBM memory architectures is still in its early innings for consumable test components — each new silicon generation resets the socket lifecycle and reopens the pricing conversation from a position of design authority. Lino's financial fortress (no meaningful debt, ₩462 billion net cash) allows the company to invest through semiconductor downturns without financial distress or shareholder dilution, giving it a durable competitive advantage over less well-capitalized socket suppliers. And the 47% operating margin provides an enormous cushion: even at a hypothetical 30% margin the business would generate substantial cash flow, meaning that a moderate demand softening would impair earnings but not threaten the enterprise.

The countervailing risks are equally clear. If the semiconductor equipment investment cycle turns — driven by customer inventory digestion, demand disappointment in AI end-markets, or broader macroeconomic deterioration — Lino's order volumes will contract, and the high fixed-cost operating model that amplifies upside will amplify downside with equal force. The company's own disclosures explicitly acknowledge that revenue will decline if customers reduce their capital investment programs. The 80% export concentration, while partially self-hedging through foreign-currency procurement, remains a source of translational volatility if the won-dollar rate moves materially in either direction. And the Q1 operating-cash-to-earnings ratio of 0.50 — while diagnostically explained by identifiable seasonal factors — warrants monitoring through Q2 to confirm that the underlying cash collection dynamics remain intact and receivables Days Sales Outstanding is not quietly extending.

For investors evaluating the risk-reward, the most critical variable is not the next quarter's margin — which is unlikely to diverge materially from the structural range absent a sharp demand reversal — but the duration of the AI-driven semiconductor test demand cycle. If WSTS projections for 26% global semiconductor market growth in 2026 prove directionally accurate, Lino's subsequent quarters should sustain or modestly extend Q1 performance. If the cycle shortens due to inventory corrections or capital budget reductions at major semiconductor manufacturers, the response in Lino's results will be both rapid and proportional to the fixed-cost leverage that makes the upside so distinctive.


This report is prepared for informational purposes based on the DART-filed Q1 2026 Quarterly Report (31st Fiscal Year) of Lino Industrial (리노공업) and does not constitute investment advice or a solicitation to buy or sell securities. LineVest News is not affiliated with any brokerage and has received no compensation from Lino Industrial or any related entity. All figures are from standalone financial statements. Source: DART — Lino Industrial 31st Fiscal Year Q1 Quarterly Report, filed May 14, 2026.

見出しの先を読む

何が起きたかは読みました。次は、それが何を意味するかを。

無料デイリーブリーフィング

韓国市場を毎朝 — 無料で

LineVest Dailyがソウル市場の寄付き前に届きます:KOSPI・KOSDAQの主要ストーリー、決算、開示、外国人フロー — わかりやすい英語で。無料、カード登録不要。

LineVest Dailyを無料で →
この企業

Lino Industrialの詳細レポート

Lino Industrialの最新DART開示を全て読み込みます — K-IFRSの財務、ガバナンス、株価への意味まで。3時間以内にPDFでお届け。

$12・買い切り

Lino Industrialレポートを入手
ウォッチ銘柄すべて

市場全体をフォロー

週に何銘柄も韓国株を見ていますか?すべての分析記事を公開と同時に — デイリーのKOSPI・KOSDAQ全カバレッジと90日アーカイブ。

$9.99・月額

購読する

一次資料のDART開示に基づく独立ジャーナリズム — 投資助言ではありません。証券会社との提携はありません。