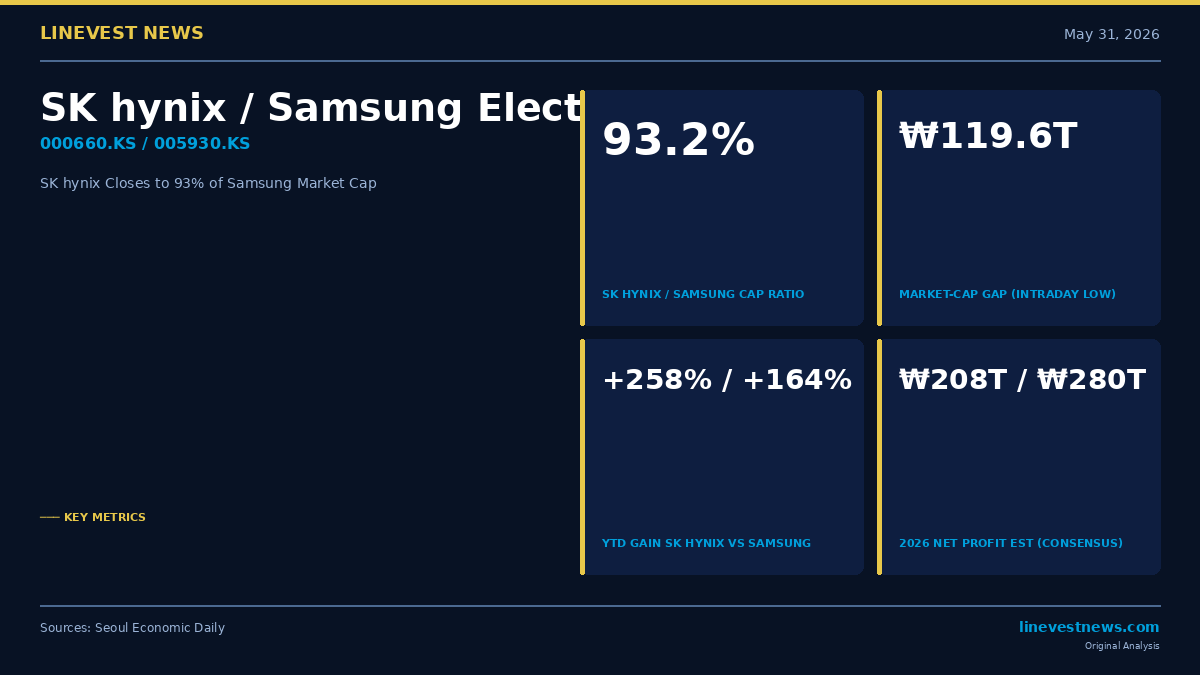
SK hynix was valued at barely half its larger rival a year ago. On Friday it closed to within 6.8 percentage points of overtaking Samsung Electronics entirely, as Korea's pure-play memory champion pushed its market capitalization to 93.2% of the conglomerate's — reigniting a debate over whether the convergence marks the apex of the AI chip supercycle or simply fair value for an HBM monopoly.
The intraday gap narrowed to ₩119.6 trillion during Friday trading, down from roughly ₩302 trillion a year ago, driven by diverging daily moves: SK hynix shares rose 2.05% on the session while Samsung Electronics fell 2.44%. Year-to-date, SK hynix has gained 258.4% against Samsung's 164.4% — a 94-percentage-point spread that reflects the market's preference for direct, undiluted exposure to Nvidia's high-bandwidth memory demand over Samsung's sprawling consumer and logic businesses.
Hana Securities analyst Lee Jae-man drew the most pointed analogy, warning that a market-cap reversal could be a signal that the current bull market based on earnings growth is ending, invoking the 2000 technology bubble when Cisco's overtaking of Microsoft marked the Nasdaq's turning point. The parallel has resonated among risk-management advocates as KOSPI margin loans hit record levels and foreign investors extend a 16-session selling streak.
Samsung's business mix has blunted its semiconductor recovery. While memory and HBM drive both companies, Samsung also runs smartphone, home-appliance and foundry divisions that have recovered more slowly, diluting the chip windfall in earnings per share. SK hynix, by contrast, derives virtually all revenue from DRAM and NAND, with HBM now its highest-margin growth engine.
Retail investors have amplified the divergence. Between May 1 and 28, domestic retail buyers net accumulated 14.769 trillion won in SK hynix shares versus 10.939 trillion won in Samsung. Yet Samsung's 2026 consensus net profit estimate of 280 trillion won still exceeds SK hynix's 208 trillion won, raising the question of whether a full market-cap reversal would price SK hynix at an unjustified premium to fundamentals.
KB Securities research head Kim Dong-won counselled against alarm: "Even if SK hynix's market capitalization temporarily surpasses Samsung Electronics, there is no need to attach great significance to that fact itself," arguing the revaluation reflects genuine operational divergence rather than the speculative dynamics that drove Cisco past Microsoft in 2000.
Sources: Seoul Economic Daily (May 31, 2026)