Record Index, Hollow Rally
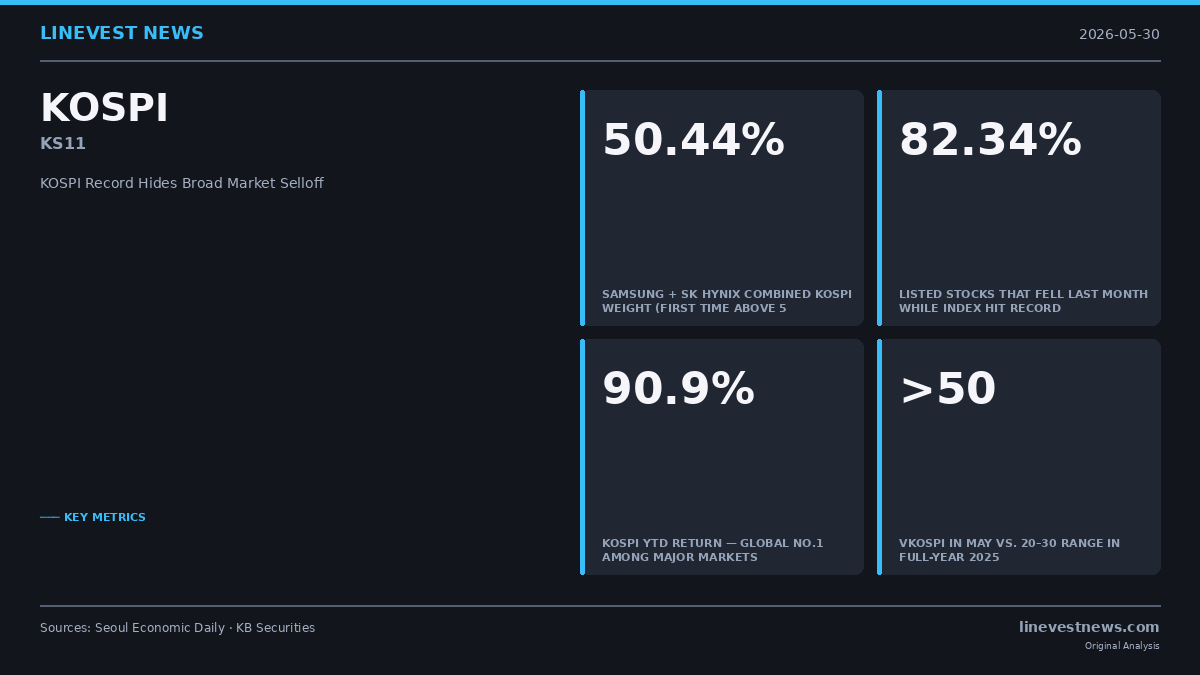
South Korea's KOSPI index closed at a historic 8,476.15 on May 29, extending a year-to-date advance of 90.9% that has made it the top-performing major equity benchmark on the planet — roughly double the 50.3% return posted by Taiwan's Taiex over the same stretch. Yet beneath that headline, the market is fracturing along a fault line that is growing harder to ignore.
Over the past month, 2,276 of the 2,764 stocks listed on the KOSPI and KOSDAQ — or 82.34% — saw their share prices fall. Only 378 issues, representing 13.68% of all listed equities, recorded gains.
The explanation fits on two ticker symbols. Samsung Electronics now accounts for 29.1% of the KOSPI's entire market capitalization. Together, Samsung and SK hynix have jointly crossed 50.44% of the benchmark — the first time the pair has held a combined majority of the index.
The Concentration Machine
Three forces have reinforced each other to produce this outcome. Global expectations for artificial-intelligence capital expenditure have kept demand forecasts for high-bandwidth memory (HBM) elevated, directly benefiting both Samsung and SK hynix. In parallel, the debut of single-stock leveraged ETFs tied to the two semiconductor names in late May channeled retail buying power into the same concentrated positions. And rising earnings revisions for chip names — at a time when most other Korean sectors face margin pressure — have given institutional allocators a fundamental rationale for the same trade.
The result is a benchmark where the electrical and electronics sector now accounts for 60.2% of total market weight. At that ratio, a 20-point swing in semiconductor stocks translates directly into a roughly 10-point index move — amplifying both the upside Korea has enjoyed in 2026 and the downside exposure embedded in the index should sentiment shift.
Korea's volatility gauge, the VKOSPI, has more than doubled from its 20–30 trading band in 2025 to levels exceeding 50 since April. The elevated reading indicates that options markets are pricing in materially higher uncertainty even as the index continues to set records.
What Analysts Are Saying
The split between bulls and bears on Korean equities reflects the same underlying facts, read differently.
NH NongHyup Bank analyst Cho Han-jo argues that concentration at this scale is a structural consequence of Korea's genuine competitive advantages, not a sign of irrational exuberance. "Rising volatility aligns with sector weight expansion rather than deteriorating fundamentals," he wrote. "The semiconductor outlook remains favorable."
The counterargument, articulated in a note by a KB Securities researcher, is more pointed. "As we approach the final stages of a bubble, concentration tends to intensify rather than ease, and this time will be no different," the analyst wrote. "When the unwinding of concentration begins, it is not a signal of a 'welcome broadening' but rather a precursor to a 'bubble collapse.'"
BTIG strategists flagged a similar concern, warning that the index was at risk of a swift downside reversal if positioning in semiconductor names were to unwind rapidly.
The Investor Paradox
The data pose an unusual problem for equity allocators. Korea leads global equity markets by a comfortable margin in 2026 — a fact that has drawn international attention and fresh foreign inflows into benchmark-tracking products. But investors who bought diversified exposure to Korean equities, through equal-weighted products or positions in sectors outside chips, experienced actual losses last month, even as the headline index extended its record run.
That dynamic is not new to equity markets where a handful of mega-caps dominate. In the United States, the "Magnificent Seven" concentration debate ran for two years before showing signs of rotation. Korea's version is more compressed: two names, not seven, and a weight that now exceeds half the entire benchmark.
For now, the bull case rests on a simple proposition — that AI investment continues to expand, HBM demand stays firm, and Samsung and SK hynix capture an outsize share of that growth. The bear case requires only that one of those links breaks.
Sources: Seoul Economic Daily (May 29–30, 2026); KB Securities research note; NH NongHyup Bank research note; BTIG strategy note (May 28, 2026)