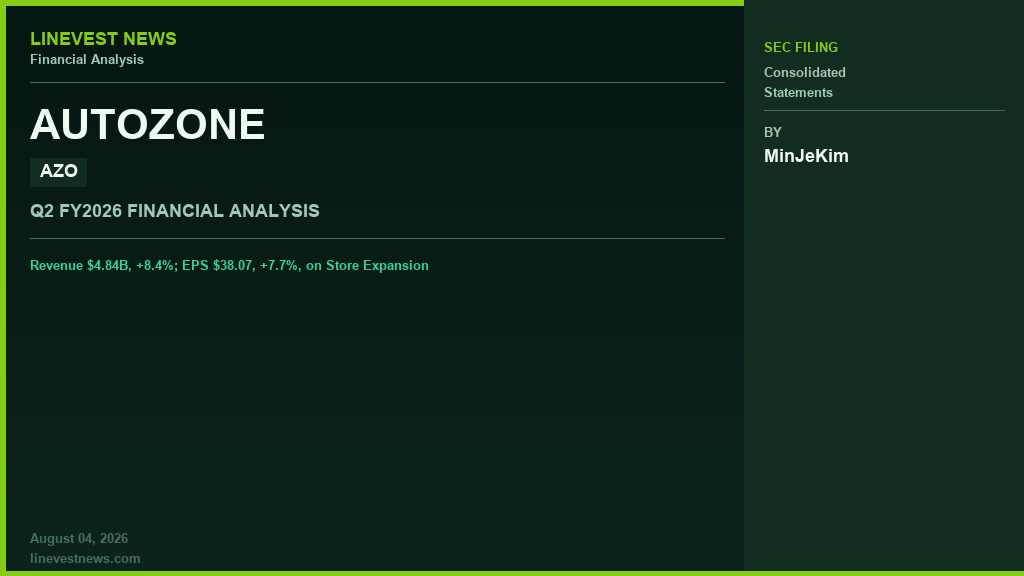
AutoZone (AZO) Q2 2026: Revenue $4.84B, +8.4%; EPS $38.07, +7.7%, on Store Expansion
(Note: AutoZone's fiscal year ends in August. The "12-week" period in this report corresponds to fiscal Q3 FY26, or calendar Q2 2026.)
Overview
AutoZone, the leading US auto-parts retailer, posted quarterly revenue of $4,840.9 million for the 12 weeks ended May 9, 2026, up 8.4% year over year, alongside diluted EPS of $38.07, up 7.7%. The results came despite a turbulent tariff environment — marked by a February 20 court ruling invalidating IEEPA-based tariffs and the subsequent imposition of new duties — that compressed gross margin by 50 basis points to 52.2% (from 52.7% a year earlier). On a 36-week basis, gross margin fell 142 bps to 51.9%, while cumulative operating income contracted 0.3%. The LIFO reserve swelled from $83 million to $260 million — a 3.1x surge driven by tariff-related cost inflation. Share repurchases over the 36-week period totaled $1,322.4 million.
1. Consolidated Balance Sheet Analysis
1-1. Key Asset Comparisons
| Item | Prior Period ($M) | Current Period ($M) | Change | Interpretation |
|---|---|---|---|---|
| Cash and cash equivalents | 271.8 | 253.7 | -6.7% | Cash outflows from buybacks; absolute level remains stable |
| Accounts receivable | 670.1 | 764.9 | +14.1% | Signals expansion in B2B commercial sales (shops, fleets) |
| Inventories | 7,025.7 | 7,559.1 | +7.6% | Proactive pre-tariff stocking + LIFO inflation |
| Property and equipment, net | 7,062.5 | 7,797.0 | +10.4% | $997.5M capex deployed — new stores and distribution centers |
| Goodwill | 302.6 | 302.6 | 0.0% | No M&A growth is entirely organic |
In depth: Total assets rose 8.1% to $20.9 billion. The 14.1% surge in accounts receivable stands out. AutoZone's revenue mix spans DIY (retail, cash-based) and commercial B2B (invoiced). Accounts receivable climbed 14.1% versus the fiscal year-end balance as of August 30, 2025. While the measurement periods differ and a direct comparison with the 12-week revenue growth rate is not straightforward, domestic commercial sales grew 10.4% over 12 weeks and 11.6% over 36 weeks — both outpacing total company growth of 8.4% and 8.3%, respectively — which supports the inference that receivables growth reflects rising B2B penetration. Inventories increased $533.4 million (+7.6%). Over the same period, the LIFO credit reserve rose $177 million (to $260 million from $83 million); per Note B, this increment is recognized as a non-cash charge in cost of goods sold. Accordingly, the physical inventory build underlying the balance-sheet increase was achieved on top of absorbing that headwind.
1-2. Liability Structure — Financial Debt vs. Operating Liabilities
Financial debt: Long-term debt stood at $9,016.5 million (up 2.5% from $8,799.8 million). The $400 million 3.125% senior notes that matured April 21 were repaid, but commercial paper (CP) outstanding expanded by $609.4 million to $1,358.0 million (from $748.6 million). The weighted-average CP rate was 3.96% (versus 4.46% in the prior period), providing some funding-cost relief. The $2.25 billion revolving credit facility remains largely undrawn, preserving capacity to refinance upcoming bond maturities on a longer-dated basis.
Operating liabilities: Accounts payable reached $8,401.3 million (+4.7%). Of that, $5.6 billion represents balances under a supplier financing program (prior period: $5.4 billion), accounting for roughly two-thirds of total payables. Under this arrangement, a third-party bank pays suppliers early while AutoZone settles at maturity — an effective working-capital lever, though one that carries supplier-attrition risk in a rising-rate environment.
1-3. Capital Structure
AutoZone carries a stockholders' deficit of -$2,784.6 million. Common stock at par totals $1.7 million (16,592 thousand shares at $0.01 par), additional paid-in capital adds $1,967.5 million, but retained earnings are a deficit of -$3,750.1 million and treasury stock stands at -$865.1 million. This is not a financial distress signal. It reflects $39.8 billion in cumulative share repurchases since 1998 (approximately 156 million shares). The deficit actually narrowed from -$3,414.3 million to -$2,784.6 million — a $629.8 million improvement — driven by $147.6 million in foreign currency translation gains and the reinvestment of net income.
2. Consolidated Income Statement Analysis
2-1. Key Profitability Metrics (12-Week Period)
| Item | Prior Period ($M) | Current Period ($M) | Change |
|---|---|---|---|
| Net sales | 4,464.3 | 4,840.9 | +8.4% |
| Operating profit | 866.2 | 923.8 | +6.6% |
| Operating margin (%) | 19.4% | 19.1% | -0.3 pp |
| Net income | 608.4 | 641.5 | +5.4% |
| Net margin (%) | 13.6% | 13.3% | -0.3 pp |
36-week cumulative: Net sales of $13,743.7 million (+8.3%) approached double-digit growth, but operating income of $2,406.4 million (-0.3%) and net income of $1,641.2 million (-1.2%) contracted. The top-line gains were fully absorbed by higher costs. However, the reduction in diluted share count from buybacks kept diluted EPS at $96.69, up 0.5% from $96.17 — illustrating AutoZone's core EPS-management playbook.
2-2. Fixed vs. Variable Cost Breakdown
Breaking down 12-week selling, general & administrative (SG&A) expense by cost nature: - Fixed-cost-oriented: Labor $972.9 million (+8.2%), rent $122.5 million (+9.6%), depreciation and amortization $138.2 million (+8.8%) — approximately $1.23 billion combined - Variable-cost-oriented: Advertising $25.3 million (+2.3%, lagging revenue growth), other items including fleet, utilities and property taxes of $341.9 million - Cost of goods sold (predominantly variable): $2,316.4 million, representing 47.9% of sales (prior period: 47.3%) — a 60-bps deterioration attributable to tariff-driven inflation
Operating leverage: SG&A as a percentage of sales improved 20 bps to 33.1% (from 33.3%), confirming that the SG&A cost line is not the source of margin pressure. The gap between 8.4% revenue growth and 6.6% operating income growth traces entirely to gross-margin compression — the company specifically identified approximately $36 million of unfavorable non-cash LIFO impact (equivalent to 77 bps on gross margin) as the primary driver. On a 36-week basis, SG&A as a percentage of sales was 34.3% versus 34.2% in the prior period, reflecting the cost absorption from net 199 new store openings (versus 163 in the prior-year period). As of May 2026, the store count stands at 6,766 domestic, 933 Mexico, and 157 Brazil.
3. Cash Flow Statement Analysis (36-Week Cumulative)
| Item | Prior Period ($M) | Current Period ($M) | Change |
|---|---|---|---|
| Operating cash flow | 2,164.6 | 2,119.6 | -45.0 |
| Investing cash flow | -917.3 | -1,013.1 | -95.8 (larger outflow) |
| Financing cash flow | -1,277.8 | -1,130.6 | +147.2 |
| Ending cash balance | 268.6 | 253.7 | -14.9 |
Key takeaways: - Operating cash flow down slightly (-2.1%): Despite comparable net income, higher depreciation (+$48.3 million) and a reversal in other non-cash items (+$193 million) were offset by a wider deferred tax benefit (-$59.3 million versus -$157.7 million) and a smaller accounts-payable build ($600.4 million versus $347.5 million). The $177 million non-cash adjustment embedded in other items reflects the LIFO reserve increase from tariff-driven cost inflation. - Capex of $997.5 million (+12.6%): Supports net 199 new store openings over 36 weeks plus hub and distribution center expansion. Annualized, this run rate moves into the $1.4 billion range. - Free cash flow (FCF): $2,119.6M − $997.5M = $1,122.1 million (versus $1,279.0 million in the prior period, -12.3%). Share repurchases of $1,322.4 million exceeded FCF by $200.3 million — the deficit was funded through net CP issuance, deepening AutoZone's reliance on short-term borrowing to finance its buyback program. - The $400 million 3.125% senior notes repaid April 21 were effectively rolled into approximately $600 million of new CP at 3.96%.
4. Additional Areas Requiring Attention
IEEPA tariff refund optionality — Following the February 20 Supreme Court ruling invalidating IEEPA-based tariffs, AutoZone filed for a tariff refund on April 20. The company has not recognized any refund amount in its financial statements. If and when refunds are received, the benefit would flow through as a non-recurring pre-tax gain — a potential upside surprise in a future quarter.
LIFO reserve up 3.1x — The reserve rose $177 million to $260 million, effectively front-loading tariff- and inflation-driven procurement cost increases into the current period's cost of goods sold. A deflationary reversal would release this reserve as a credit to cost of goods sold, representing a latent margin tailwind.
$5.6 billion supplier financing program — Two-thirds of accounts payable sits within a third-party supplier financing arrangement. Under FASB ASU 2022-04, expanded disclosure of such programs is now required. Should financing conditions tighten or key suppliers exit the program, AutoZone's working-capital requirements could increase sharply — a concealed leverage element.
Sustainability of the stockholders' deficit — AutoZone targets an investment-grade credit rating, with management disclosing in the 10-Q a goal of maintaining adjusted debt-to-EBITDAR at approximately 2.5x. The -$2.8 billion equity deficit is underwritten by stable FCF and an effectively undrawn $2.25 billion revolving credit facility. The key question is whether FCF continues to cover capex plus buybacks as repurchase volumes exceed free cash generation.
Store expansion vs. same-store growth balance — The total store base stands at 7,856 locations across the Americas. The 8.4% revenue increase in the 12-week period was driven by domestic commercial same-store sales of +3.9% (constant currency; +5.5% as reported), supplemented by $129 million in sales from new stores. Domestic commercial B2B sales rose 10.4% (+$132.4 million) over 12 weeks — ahead of total company growth. On a 36-week basis, total company same-store sales grew 4.0% on a constant-currency basis.
5. Key Takeaways and Outlook
Bull case: (1) IEEPA tariff refunds, if realized over the next two to three quarters, could generate a non-recurring pre-tax benefit in the hundreds of millions of dollars. (2) The $260 million LIFO reserve represents a latent gross-margin lever — a deflationary shift would convert today's headwind into a tailwind. (3) The 14% rise in accounts receivable points to continued commercial market-share gains. (4) A remaining $800 million buyback authorization plus a largely undrawn $2.25 billion revolver (available through November 2028) provide the runway to sustain EPS management.
Risks: (1) Additional tariff rounds could push the cost-of-goods rate — already up 60 bps to 47.9% — even higher. (2) Funding buybacks beyond FCF through CP increases short-term borrowing exposure; a rate re-acceleration would raise funding costs. (3) Labor cost growth running at or above revenue growth eliminates operating leverage on the SG&A line. (4) In a stockholders'-deficit position, a credit-rating downgrade would raise borrowing costs and erode market confidence. The near-term trigger to watch is the timing of any tariff refund; the medium-term metrics are commercial segment revenue mix and the trajectory of same-store sales growth.
Disclaimer
This report is prepared for informational purposes based on the quarterly report (Form 10-Q) filed with the SEC, and does not constitute investment advice.