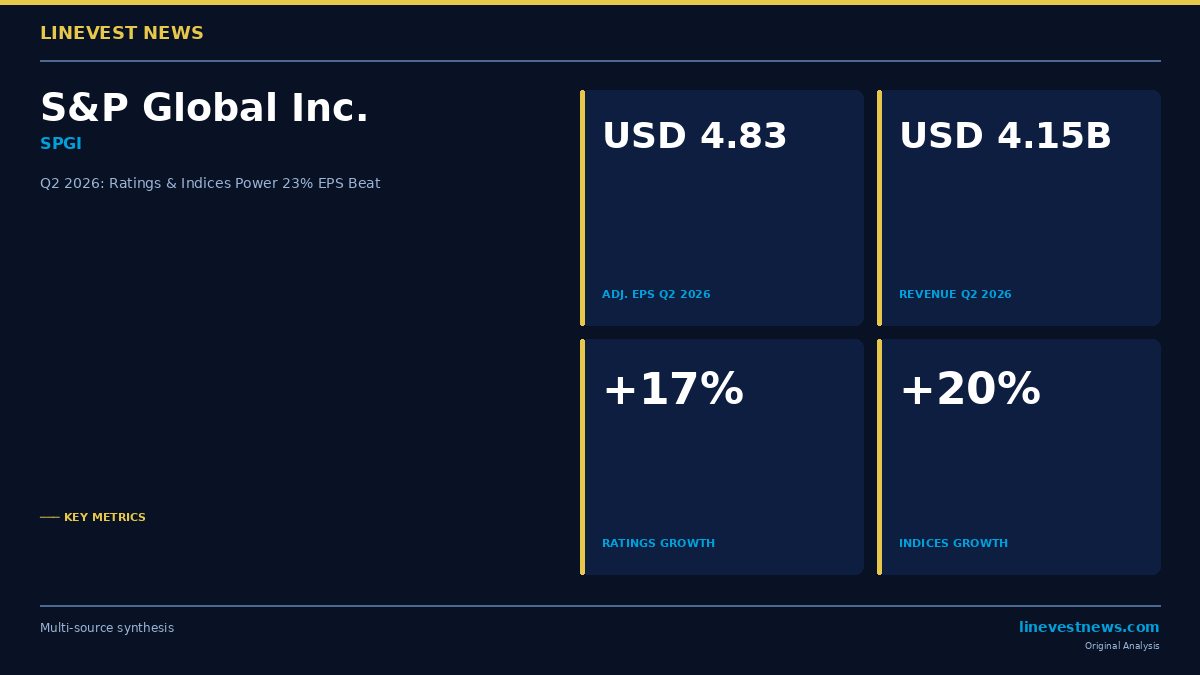
TL;DR - Adjusted EPS USD 4.83 (+23% YoY) beat USD 4.49 consensus by 7.6%; Q2 revenue USD 4.15B beat USD 4.09B estimate (+10% YoY) - Ratings division surged +17%, S&P Dow Jones Indices delivered its 13th consecutive record quarter (+20%) - USD 7B buyback target for 2026—raised by USD 3B after Mobility Global (MBGL) spin-off completed July 1 - SPGI fell ~5.2% on earnings day to ~USD 417; currently trading ~USD 412, roughly 28% below 52-week high of USD 579
Part A: Q2 2026 Results at a Glance
S&P Global (NYSE: SPGI) reported second-quarter 2026 results on July 28, 2026, posting strong adjusted-basis outperformance while navigating the structural transition triggered by the Mobility Global spin-off.
Headline Numbers
| Metric | Q2 2026 | YoY Change |
|---|---|---|
| Reported Revenue | USD 4.15B | +10% |
| Organic CCY Revenue Growth | +11% | — |
| Adjusted EPS | USD 4.83 | +23% |
| Consensus Adj. EPS Estimate | USD 4.49 | Beat +7.6% |
| Adjusted Operating Margin | 54.3% | +200 bps |
| Full-Year Adj. EPS Guidance | USD 17.50–17.75 | Raised |
Segment Performance
| Division | Revenue Growth | Adj. OP Margin | YoY Margin |
|---|---|---|---|
| Ratings | +17% | 68.5% | +310 bps |
| S&P Dow Jones Indices | +20% | 71.5% | +90 bps |
| Market Intelligence | +6% | 36.0% | +120 bps |
| Energy (Commodity Insights) | +3% | 47.5% | +70 bps |
Ratings led with transaction revenues surging 25%, fueled by robust investment-grade bond issuance (up ~20%) and surging hyperscaler debt activity. Hyperscaler companies issued USD 169 billion in bonds in H1 2026; S&P raised its full-year hyperscaler issuance forecast to USD 250–300 billion. Private markets revenue jumped 60% as alternative asset managers expand globally.
S&P Dow Jones Indices delivered its 13th consecutive record quarter: asset-linked fees rose 22% (fourth straight record), exchange-traded derivatives fees climbed 22%, and ETF assets under management reached USD 6.35 trillion. The first S&P 500-tracking ETF crossed USD 1 trillion in assets under management during the quarter—a symbolic milestone that also generates recurring asset-linked fee income for SPGI.
Market Intelligence grew 6% organically. Management noted elongated enterprise sales cycles caused by clients restructuring AI data procurement contracts. SPGI announced plans to reorganize Market Intelligence into two units: Kensho Data & Platforms (AI-native APIs and raw data) and Enterprise Solutions (workflow software and analytics).
Energy (Commodity Insights) posted 3% growth, below the company's 6–8% long-run target. Iran conflict-related volatility and related sanctions reduced Platts growth by approximately 120 basis points. Management expects normalization as conditions stabilize. SPGI also announced the acquisition of datacenterHawk, an infrastructure intelligence firm, to strengthen its energy-transition and data-center analytics offering.
The Mobility Spinoff Explained
On July 1, 2026, SPGI completed the separation of Mobility Global Inc. (NYSE: MBGL), distributing one MBGL share for every SPGI share held on June 15. Mobility Global—serving automotive dealers, insurers, and OEMs with data and analytics—now trades independently. The spinoff generates a USD 2 billion dividend to SPGI, helping fund the expanded buyback program. SPGI stock was down ~5.2% on earnings day as investors recalibrate the company's standalone profile without Mobility.
Part B: Investment Implications
The USD 7B Buyback: An Unusual Signal of Confidence
SPGI raised its 2026 share repurchase target by USD 3 billion to more than USD 7 billion—representing over 5% of its roughly USD 130 billion market capitalization. Funding sources include the USD 2 billion Mobility spinoff dividend and USD 2 billion in planned new debt issuance in H2. Leverage will temporarily rise to 2.7–2.8x EBITDA (above the 2.0–2.5x long-term target), with management projecting natural deleveraging to normalize by end of 2027.
A 5%+ buyback yield from a company generating over 80% of its operating profit from benchmark franchise businesses (Ratings, Indices, Platts) signals management's conviction in sustained free-cash-flow generation. Benchmark businesses compound recurring revenues with minimal incremental capital requirements—a structural attribute that justifies the aggressive buyback.
AI Monetization: Real Traction, Real Friction
S&P Global's AI client count exceeded 500 in Q2—a 70% year-over-year increase. Kensho API call volumes increased fivefold quarter-over-quarter. AI-connected customers are growing annual contract values 60% faster than non-AI customers.
The friction: enterprise clients are restructuring how they procure AI data, leading to elongated sales cycles. This is the core reason Market Intelligence growth remained below the company's long-run target. The upcoming reorganization into Kensho Data & Platforms and Enterprise Solutions aims to price AI-native services more precisely and reduce negotiation complexity.
Hyperscaler Debt Boom: Upstream for the AI Infrastructure Cycle
SPGI's Ratings division is a direct financial beneficiary of the AI capital-expenditure cycle. Hyperscalers (Amazon AWS, Microsoft Azure, Google Cloud, Meta AI) are issuing record volumes of investment-grade bonds to fund data-center and GPU buildouts. S&P raised its full-year hyperscaler issuance forecast to USD 250–300 billion.
This matters for Korean investors: the same AI capex boom driving hyperscaler bond volumes is the underlying demand engine for High Bandwidth Memory orders at SK Hynix (000660.KS) and Samsung Electronics (005930.KS). S&P's sustained-issuance forecast through H2 provides an independent cross-validation of the AI infrastructure capex cycle that underpins the Korean memory semiconductor investment thesis.
S&P Indices: A Royalty Stream on Global Passive Investing
The S&P 500 ETF ecosystem crossing the USD 1 trillion single-fund milestone underscores how SPGI's index franchise has become a recurring royalty on global wealth accumulation. For every incremental dollar flowing into S&P 500-tracking products, SPGI collects asset-linked fees. As Korean institutional investors—through TIGER, KODEX, and ACE S&P500 products—increase passive allocations, this revenue stream compounds regardless of the equity market direction.
Risks Investors Should Monitor
| Risk | What to Watch |
|---|---|
| Market Intelligence slowdown | AI contract restructuring elongating sales cycles; Q3 organic growth trend |
| Energy segment headwinds | Iran conflict normalization timeline; datacenterHawk integration |
| Cboe SPX options license | Over USD 200M annual fee; upcoming renewal terms could shift pricing dynamics |
| Post-spin leverage | 2.7–2.8x EBITDA temporarily above 2.0–2.5x target; H2 free cash flow execution |
| Valuation recalibration | SPGI ~28% below 52-week high post-Mobility spinoff; H2 guidance delivery critical |
Valuation Context
SPGI trades at approximately USD 412 as of early August 2026, roughly 28% below its 52-week high of USD 579. Analyst consensus is Buy with an average target of approximately USD 525—implying roughly 27% upside from current levels. The quarterly dividend of USD 0.97 (USD 3.88 annualized) equates to approximately 0.9% yield. The post-earnings decline reflects the complexity of the Mobility spinoff transition, not deterioration in the core benchmark franchise, which delivered its strongest margin expansion in years.
Sources
- BigGo Finance — SPGI Q2 2026 Earnings Call Highlights
- Yahoo Finance — S&P Global Beats Q2 Earnings and Revenue Estimates
- Stocktitan — S&P Global Q2 2026 Revenue +10%, Mobility Spin-Off
- Seeking Alpha — SPGI Stock Dips as Q2 Earnings Adjust for Mobility Spinoff
- SEC EDGAR — SPGI Form 8-K (July 28, 2026)
This article is for informational purposes only and does not constitute investment advice. LineVest is not a registered investment adviser.