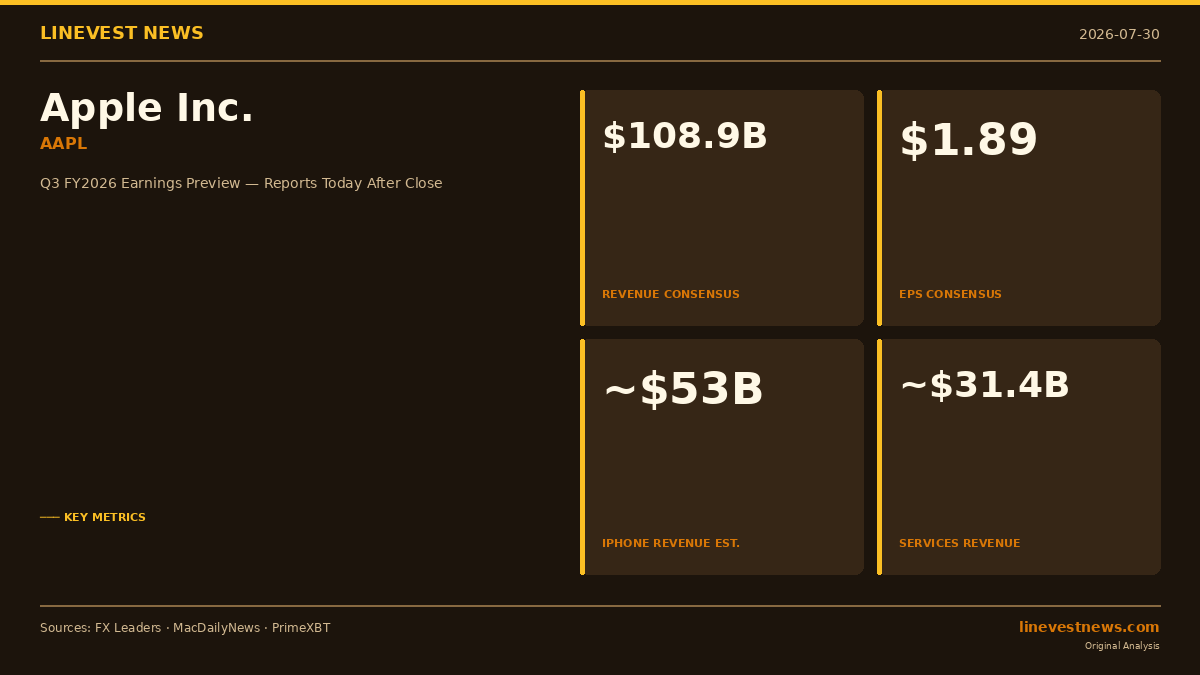
TL;DR - Apple reports Q3 FY2026 today after the close; analyst call at 5 PM ET - Revenue consensus: ~$108.9B (+16% YoY vs. $94.0B); Diluted EPS: $1.89 (+20% YoY) - iPhone segment: ~$53B (+19–23% YoY); Services: ~$31.4B (+14–15% YoY, margin >70%) - Stock: $338 (−0.56% pre-earnings), market cap ~$5 trillion, trailing P/E ~40× - Tim Cook's anticipated final earnings call before John Ternus becomes CEO on September 1
Part A — What Wall Street Expects
Apple will release fiscal Q3 2026 results after the market close on July 30, followed by an analyst call at 5:00 PM ET led by CEO Tim Cook and CFO Kevan Parekh.
Consensus Scorecard
| Metric | Q3 FY2026 Consensus | Q3 FY2025 Actual | YoY Change |
|---|---|---|---|
| Total Revenue | ~$108.9B | $94.0B | +16% |
| Goldman Sachs Estimate | $110.1B | — | — |
| UBS Estimate (low end) | $107.8B | — | — |
| Diluted EPS | $1.89 | $1.57 | +20% |
| iPhone Revenue | ~$53B | ~$44.6B | +19–23% |
| Services Revenue | ~$31.4B | ~$27.4B | ~+15% |
| Gross Margin Guidance | 47.5–48.5% | 46.3% | +120–220 bps |
| Operating Expenses (guidance) | $18.8–$19.1B | — | — |
Apple has beaten both revenue and EPS estimates in each of the past eight consecutive quarters, with an average positive earnings surprise of more than 7%. Goldman Sachs projects $110.1B in revenue and $1.93 EPS, with a price target of $370. Bank of America models ~$109B / $1.89. UBS takes the cautious end at $107.8B / $1.84.
Management's own April guidance called for revenue growth of 14–17% YoY, gross margin of 47.5–48.5%, and operating expenses of $18.8–$19.1B — ranges that Wall Street consensus sits comfortably inside.
Part B — Analysis: Five Storylines That Will Define the Print
1. Tim Cook's Legacy Send-Off
This earnings call carries symbolic weight beyond the numbers. Cook is widely expected to field analyst questions as Apple's chief executive for the last time before hardware engineering chief John Ternus, 50, assumes the CEO role on September 1. Ternus, a University of Pennsylvania mechanical engineering graduate who joined Apple's product design team in 2001, will inherit a company sitting at roughly $5 trillion in market capitalization — a figure Cook himself helped build from less than $400 billion when he succeeded Steve Jobs in 2011.
Investors and media will parse every word Cook uses to frame the AI roadmap and succession narrative. Any commentary about near-term product launches, Ternus's strategic direction, or Apple's competitive positioning against Microsoft's Copilot and Google Gemini could move the stock regardless of the headline numbers.
2. iPhone: Durable Upgrade Cycle or Peak?
The iPhone segment — expected to deliver roughly $53B in Q3, up 19–23% from $44.6B a year ago — remains the single largest revenue driver. The high-end consensus reflects strong demand for Apple Intelligence-enabled handsets, particularly in the Greater China market, where iPhone shipments have been running above trend.
Bulls and bears are split on whether the current upgrade wave is structural or cyclical. Prior-quarter China revenue reached $20.5B (+28% YoY), partly driven by pent-up demand for Apple Intelligence features that launched later in the region. The key question: will that momentum sustain into the iPhone 18 launch cycle this fall, or will it reveal a pull-forward from future quarters?
App Store growth cooling to approximately 3.2% from 9.8% in recent periods is one early caution sign. If Services decelerate faster than expected, it will dampen the narrative that Apple's ecosystem is becoming increasingly software-driven.
3. Services: The Margin Engine Wall Street Cannot Ignore
Services revenue consensus of ~$31.4B would represent roughly 15% YoY growth from $27.4B — slower than the 16%-plus rates of prior quarters but still operating at margins above 70%, which are structurally accretive to the consolidated gross margin picture.
That margin profile is why analysts are almost universally positive on the Services trajectory: every incremental dollar of App Store, AppleCare, iCloud, and Apple TV+ subscription revenue converts to operating income at a rate most hardware companies cannot match. Services crossing $30B/quarter on a recurring basis cements Apple's pivot from a device-sale to a device-plus-ecosystem model.
The risk here is regulatory. EU Digital Markets Act obligations and ongoing DOJ scrutiny of the App Store commission structure remain live headwinds. Any update from management on compliance costs or settlement reserves will be closely watched.
4. Capital-Light AI vs. the Capex Peers
As Meta and Microsoft posted massive capex figures this week — Meta raising FY2026 capex guidance to $130–$145B and Microsoft spending $35.8B in Q4 alone — Apple's AI strategy looks conspicuously different. Apple has leaned into on-device inference for most Apple Intelligence tasks, reserving Private Cloud Compute for heavier workloads rather than building massive hyperscale data centers.
That capital-light approach protects near-term free cash flow and margins but raises a legitimate competitive question: can on-device models stay competitive with Google's Gemini Ultra and OpenAI's latest models in the features that drive purchase decisions? Cook is expected to provide color on the Apple Intelligence roadmap and adoption metrics. Any concrete user statistics — active users of AI features, Apple Intelligence device penetration — would be new disclosures that the market will immediately price.
A $30B+ multiyear supply agreement with Broadcom signals that Apple is spending on custom silicon, but its capex intensity as a share of revenue remains a fraction of its big-tech peers.
5. Valuation and the $5 Trillion Question
AAPL trades at approximately 40× trailing earnings — well above its 10-year average of roughly 25×. That premium already embeds a durable AI tailwind, continued Services compounding, and a leadership transition the market appears to view as low-risk. The stock has gained roughly 25% year to date, briefly touching a $5 trillion market cap in the days before this print.
At 40×, the margin for disappointment is thin. A miss on Services — the highest-margin and most valuation-relevant segment — or softer-than-expected Q4 guidance could reprice the stock meaningfully. Technical resistance sits at $343 and $350–$352; key support levels are at $334–$336 and $331–$328.
One additional watch item: component costs tied to the global memory chip shortage have already forced Apple to raise Mac and iPad prices by up to $300 in certain configurations. If management signals that NAND or DRAM sourcing constraints are beginning to pressure iPhone bill-of-materials for the iPhone 18 build cycle, it would be the single most negative data point of the call.
What to Watch: Q4 Forward Guidance
Fiscal Q4 runs August through October — the quarter that includes the iPhone 18 launch. The guidance range Cook and Parekh provide tonight will be the most direct read-through on whether Apple expects the back-to-school and iPhone launch season to sustain the current growth trajectory. A Q4 revenue guidance of $120B+ would broadly confirm the upgrade cycle thesis; a number closer to $115B would raise questions about whether management is cautious ahead of the CEO transition.
This article is based on analyst consensus estimates and publicly available information prior to the earnings release. Actual results will be reported after the market close on July 30, 2026. This is journalism, not investment advice. LineVest is not a registered investment advisor.
Sources - FX Leaders — AAPL Stock Holds $338 Before Apple Earnings - MacDailyNews — What Wall Street Expects from Apple's Q3 Earnings - PrimeXBT — Apple Q3 2026 Earnings Preview: iPhone, Services and Capital-Light AI - The Motley Fool — Apple Reports Q3 Earnings on July 30 - TipRanks — Apple Reports Q3 Earnings on July 30 - 9to5Mac — Apple Sets Q3 2026 Earnings Release for July 30