TL;DR
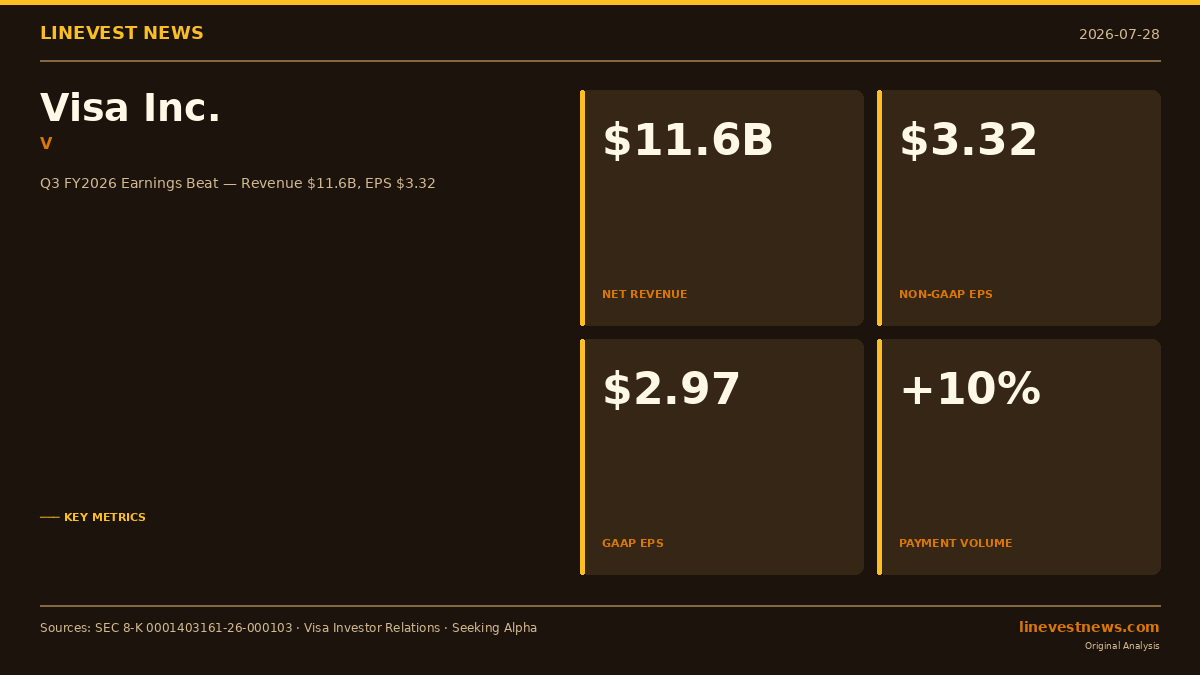
- Net revenue $11.6B (+14% YoY; +13% constant-dollar), beating the $11.40B consensus
- Non-GAAP EPS $3.32 (+11% YoY), topping the $3.22 Street estimate
- Payment volume +10%, cross-border volume +13% (ex-intra-Europe), processed transactions 71.7B
- FIFA World Cup 2026 lift: cross-border transactions in host cities (U.S./Canada/Mexico) rose ~20% YoY during the tournament window
- $4.9B in share repurchases in Q3; quarterly dividend of $0.670/share
- After-hours stock eased ~0.3% to ~$361.51 after closing up 1.1% at $366.49
Part A — Filing Summary
Visa Inc. (NYSE: V) filed an 8-K (Items 2.02, 8.01, 9.01) with the SEC on July 28, 2026 (accession no. 0001403161-26-000103), releasing fiscal third-quarter 2026 results.
Income Statement Highlights
| Metric | Q3 FY2026 | Q3 FY2025 | YoY Change |
|---|---|---|---|
| Net Revenue | USD 11.6B | ~USD 10.2B | +14% (+13% constant-$) |
| GAAP Net Income | USD 5.6B | ~USD 5.2B | +7% |
| Non-GAAP Net Income | USD 6.3B | ~USD 5.8B | +8% |
| GAAP Diluted EPS | USD 2.97 | ~USD 2.70 | +10% |
| Non-GAAP Diluted EPS | USD 3.32 | ~USD 2.99 | +11% |
Visa beat both the EPS consensus of USD 3.22 and the revenue consensus of USD 11.40B.
Revenue Breakdown
| Revenue Line | Q3 FY2026 | YoY Change |
|---|---|---|
| Service revenue | USD 4.9B | +14% |
| Data processing | USD 6.0B | +17% |
| International transactions | USD 3.9B | +6% |
| Other revenue | USD 1.5B | +45% |
| Client incentives (contra) | (USD 4.7B) | +18% |
Client incentives — a contra-revenue deduction representing volume-based rebates to banking partners — grew 18%, outpacing net revenue growth of 14%, a trend that bears watching for margin trajectory in coming quarters.
Volume and Transaction Metrics (Constant-Dollar)
| Metric | Q3 FY2026 |
|---|---|
| Payments Volume | +10% |
| Cross-Border Volume (total) | +13% |
| Cross-Border Volume (ex-intra-Europe) | +12% |
| Processed Transactions | 71.7B (+10%) |
Capital Allocation
Visa repurchased 14.5 million shares at an average of USD 330.71, totaling USD 4.9B in Q3 alone. The quarterly dividend stands at USD 0.670 per Class A share. Over the first nine months of FY2026, combined shareholder returns reached USD 6.2B.
Balance Sheet (June 30, 2026)
- Cash and equivalents: USD 13.9B
- Total assets: USD 94.6B
- Total equity: USD 35.2B
Nine-Month FY2026 Summary
| Metric | 9M FY2026 |
|---|---|
| Net Revenue | USD 33.8B |
| GAAP Diluted EPS | USD 9.14 |
| Non-GAAP Diluted EPS | USD 9.79 |
Part B — Market Impact Analysis
Beat Was Real, But the Bar Was Rising
Visa's Q3 result — USD 3.32 non-GAAP EPS vs the USD 3.22 consensus — represents a 3.1% beat, consistent with the company's four-quarter average beat of approximately 3.2%. Yet after-hours shares gave back a modest 0.3%, settling near USD 361.51 after closing at USD 366.49 during regular trading.
The muted reaction is telling. At +14% revenue growth, Q3 marked a deceleration from Q2's +17% — and with non-GAAP EPS nearly flat sequentially (USD 3.32 vs USD 3.31 in Q2), the market's message appears to be: good, not great. The raised full-year guidance issued after Q2 — low-double-digit to low-teens revenue growth — is being met, not exceeded.
FIFA World Cup: A One-Time Turbocharger for Cross-Border
The standout volume story in Q3 is cross-border growth of +13% (total), driven significantly by the FIFA World Cup 2026 hosted across the United States, Canada, and Mexico. Cross-border Visa transactions in host cities reportedly rose nearly 20% YoY during the tournament window — a powerful but non-recurring event.
This matters for the forward outlook. The World Cup benefit disappears in Q4 (the October quarter), which mechanically pressures cross-border volumes. Meanwhile, international transaction revenue — the segment most directly linked to foreign-currency cross-border spend — grew only +6%, the slowest of all Visa's revenue lines. The gap between +13% cross-border volume growth and only +6% international transaction revenue growth reflects FX headwinds: when non-dollar-denominated transactions are reported in U.S. dollars, a stronger dollar compresses the dollar value of each transaction.
Data Processing at +17%: The Silent Outperformer
While headlines focus on payment volume, data processing revenue (+17% to USD 6.0B) has quietly become Visa's fastest-growing reported segment. This line captures per-transaction fees from authorization, clearing, and settlement — a direct function of processed transaction count (71.7B, +10%). The revenue-per-transaction uplift reflects Visa's success in growing Value-Added Services: fraud screening, dispute resolution, data analytics, and increasingly, stablecoin settlement rails.
Management confirmed in Q2 that Visa's stablecoin settlement volume had reached a USD 7B annual run rate. Any acceleration disclosed on the Q3 earnings call would likely be treated as a meaningful catalyst by investors tracking Visa's fintech positioning.
Agentic Commerce: The Long Runway
CEO Ryan McInerney has consistently framed agentic AI commerce — where software agents autonomously initiate micro-transactions on behalf of consumers — as a structural expansion of Visa's total addressable market. Visa's card rails are positioned to process any agent-to-merchant interaction, regardless of the AI layer on top. The company is already revising its merchant and issuer agreements to accommodate agent-initiated payments, giving it a compliance head start over potential competitors.
For now, agentic payments contribute negligibly to revenue. Management has signaled this is a three-to-five-year normalization horizon — similar to how cross-border e-commerce was a nascent channel in 2010 before becoming a double-digit revenue contributor.
Client Incentive Creep: The Key Risk to Watch
Client incentives grew 18% to USD 4.7B, outpacing net revenue growth of 14%. These rebates — paid to card-issuing banks and major co-brand merchants — reflect competitive pressure to defend volume share against Mastercard and emerging fintech networks. The math holds as long as net revenue growth remains in the low-to-mid teens. But if top-line growth decelerates toward high single digits in FY2027, incentive growth at 18% would compress reported net revenue meaningfully. This is the most important line item to monitor over the next two quarters.
Competitive Context: Mastercard Reports This Week
Mastercard (NYSE: MA) is expected to report its own quarterly results this week, offering investors a direct network-level comparison. If Mastercard's cross-border metrics lag Visa's +13%, it would validate Visa's stronger World Cup positioning. If Mastercard matches or exceeds, it suggests the broader cross-border environment is uniformly healthy and Visa's beat is less differentiated. Either data point sharpens the framework for comparing the two dominant global payment networks.
Investor Takeaway
Visa continues to execute on all core metrics — steady double-digit revenue growth, rising EPS, and USD 4.9B in Q3 buybacks alone. The Q3 numbers confirm the base case. However, three risks merit monitoring into Q4 and FY2027: (1) the World Cup tailwind evaporates, (2) client incentives are growing faster than revenue, and (3) the stock — closing near USD 367 with a market cap approaching USD 700B — already prices in sustained execution. Investors seeking acceleration rather than continuation may remain in "show me" mode until the October quarter report.
Visa Inc. 8-K filed July 28, 2026. Accession no. 0001403161-26-000103. All financial figures sourced from Visa's official Q3 FY2026 earnings release (Exhibit 99.1). This article is for informational purposes only and does not constitute investment advice.
Sources: - SEC EDGAR 8-K Filing — Visa Inc. (July 28, 2026) - Visa Investor Relations — Q3 FY2026 Earnings Announcement - Seeking Alpha — Visa Q3 earnings beat as consumer stays resilient - BigGo Finance — Visa Q2 FY2026 Earnings Call: Strongest Revenue Growth Since 2013 - American Banker — Visa bets on World Cup, agentic AI, to boost earnings