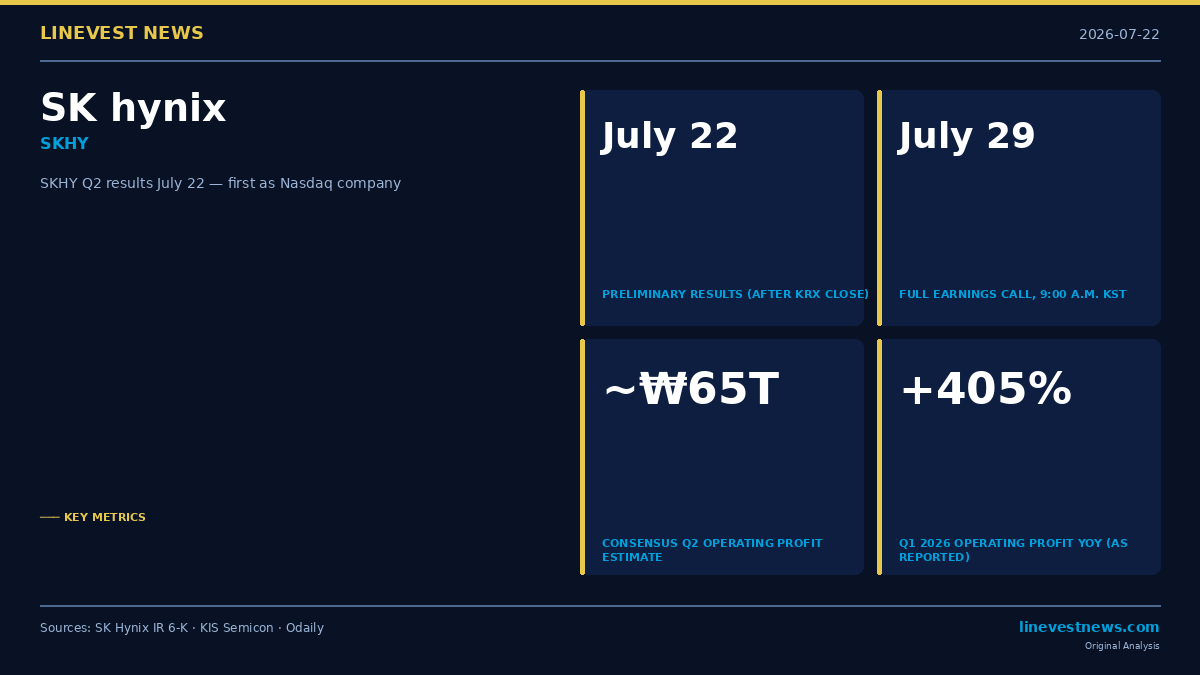
TL;DR - SK Hynix (SKHY) releases Q2 2026 preliminary results on July 22 (after KRX close); full earnings conference call follows on July 29 at 9:00 a.m. KST (8:00 p.m. ET, July 28) - Consensus operating profit: ~₩64–65T (≈$43–44B), up roughly 600% YoY from ₩9.21T in Q2 2025 - This will be SK Hynix's first earnings report as a Nasdaq-listed company (SKHY listed on Nasdaq in 2026) - Q1 2026 baseline: revenue ₩52.6T (+198% YoY), operating profit ₩37.6T (+405% YoY as reported), ~72% operating margin
Part A — Mark These Dates
SK Hynix filed a Form 6-K with the SEC confirming its Q2 2026 earnings schedule. The company follows a standard Korean large-cap disclosure format: preliminary figures first, then a formal investor call about one week later.
| Event | Date & Time | US Equivalent |
|---|---|---|
| Preliminary results release | July 22, 2026 (after KRX close, ~4 p.m. KST) | ~3:00 a.m. ET, July 22 |
| Full earnings conference call | July 29, 2026, 9:00 a.m. KST | 8:00 p.m. ET, July 28 |
The July 22 release covers headline revenue and operating profit figures. The July 29 call adds full management discussion, segment detail, and Q&A — and will stream live in Korean and English simultaneously at ir.skhynix.com; an archived replay will be posted shortly after.
Why this report matters beyond the numbers: This is the first quarterly earnings SK Hynix will announce since SKHY listed on Nasdaq in 2026, raising approximately $29.4B in one of the largest technology IPOs in US market history. US investors now have a direct equity instrument — not a thinly traded OTC ADR — and institutional shareholders who bought the IPO are watching their first post-listing print.
Q1 2026 Baseline
| Metric | Q1 2026 | Q1 2025 | YoY (as reported) |
|---|---|---|---|
| Revenue | ₩52.58T (~$35.4B) | ₩17.64T | +198% |
| Operating Profit | ₩37.61T (~$25.3B) | ₩7.44T | +405% |
| Operating Margin | 72% (a) | 42% (a) | — |
| Net Profit | ₩40.35T (~$27.2B) | ₩8.11T | +398% (b) |
USD conversions at ₩1,484.7/USD (July 16, 2026 Bank of Korea reference rate). YoY growth figures are as disclosed by SK Hynix in its official Q1 2026 earnings release.
(a) Rounded figures as officially reported. Precise unrounded values: 71.5% (Q1 2026) and 42.2% (Q1 2025), a difference of approximately 29 percentage points. (b) Net profit exceeded operating profit in Q1 2026 due to non-operating gains, including equity-method investment income and FX translation benefits; see SK Hynix IR filings for full breakdown.
Revenue crossed ₩50T in a single quarter for the first time in SK Hynix's history; operating profit nearly doubled from Q4 2025 (₩19.17T).
Q2 2026 Consensus
| Scenario | Operating Profit | Implied YoY vs Q2 2025 (₩9.21T) |
|---|---|---|
| Bear case — KIS Semicon (revised) | ₩60.4T (~$40.7B) | +556% |
| Market consensus (midpoint) | ~₩64–65T (~$43–44B) | +595–606% |
KIS Semicon analyst Minsook Chae cut the firm's Q2 OP estimate by approximately 7% (from ₩65T to ₩60.4T), citing DRAM average selling prices coming in below initial expectations: commodity DRAM ASP growth revised to 34.2% QoQ (from 60.6%) and overall DRAM ASP revised to 28.9% QoQ (from 50.0%). Long-term supply agreements with hyperscalers, while providing revenue stability, limit spot-market repricing upside.
Revenue consensus sits around ₩83T for Q2, compared with ₩22.2T in Q2 2025 (+274% YoY). SK Hynix does not issue quarterly guidance, so the July 22 preliminary release and July 29 call will be the first opportunity for management to characterise H2 2026 demand visibility.
Part B — Three Numbers Nasdaq Investors Need to Watch
1. What Management Says About HBM (Not What It Discloses)
SK Hynix does not break out High Bandwidth Memory revenue separately in its quarterly filings. The company confirms only that revenue growth was driven by high value-added products including HBM, high-capacity server DRAM modules, and eSSDs.
SK Hynix holds an estimated 56.4% share of the global HBM market (Bank of America), ahead of Samsung Electronics and Micron. Bank of America estimates the total 2026 HBM market at $54.6B, up 58% year-over-year. At 56.4% share, SK Hynix's implied HBM revenue would exceed $30B in 2026 — closer to $31B — a figure large enough to move the needle even on ₩83T+ quarterly revenues.
What to listen for on July 29: Any quantitative or qualitative comment on HBM3E (12-stack) vs HBM4 (16-stack) mix, or mention of specific hyperscaler customer expansion, would indicate whether the next product cycle is on schedule. TSMC reported Q2 2026 revenues of $40.2B (a record) and raised its full-year capex from $38–42B to $64B on July 16, citing CoWoS advanced packaging demand — a capacity bottleneck co-located with SK Hynix HBM stacks on NVIDIA and AMD GPUs. This TSMC signal is the strongest external indicator that HBM demand remained robust in Q2.
2. Whether the ~72% Operating Margin Held or Expanded
SK Hynix's Q1 2026 operating margin of approximately 72% is exceptional for a hardware company of any size. The question for Q2 is whether DRAM ASP growth — even at the revised, lower rate — was enough to drive further margin expansion, or whether higher volume with stable pricing kept margins roughly flat.
| Estimate | Q2 OP | Q2 Revenue (consensus ₩83T) | Implied Margin |
|---|---|---|---|
| KIS Semicon (bear) | ₩60.4T | ₩83T | 72.8% |
| Market consensus | ₩64–65T | ₩83T | 77–78% |
Margin drivers to monitor: - DRAM ASP trajectory: If SK Hynix confirms ASP growth was in the 29–34% QoQ range (per KIS revised estimates: 28.9% overall / 34.2% commodity), that is still substantial; a miss below 25% would be a negative signal - NAND profitability: Enterprise SSDs (eSSDs) carry higher margins than commodity NAND; any expansion of eSSD shipments improves blended margin - Fixed-cost leverage: HBM3E ramp increases fab throughput, improving overhead absorption. Management commentary on utilization rates would be informative
3. H2 2026 Demand Visibility and the Tariff Hedge
SK Hynix stock (000660.KS on KOSPI; SKHY on Nasdaq) fell approximately 36% in early July on fears that US AI infrastructure spending could decelerate, amplified by tariff risk analysis on Korean semiconductor exports. The stock recovered sharply after US CPI data surprised to the downside and several analysts reiterated bullish long-term views.
The July 29 conference call will be the first opportunity for CFO and IR commentary on: - H2 2026 order visibility: Are LTA (long-term supply agreement) volumes for HBM locked through year-end? - HBM4 ramp timing: Any update on 16-stack HBM4 customer qualification would be closely watched, as this next-generation product is expected to carry higher ASPs than HBM3E - US tariff exposure: SK Hynix manufactures primarily in Korea and has a US packaging facility under construction in Indiana. Management's characterisation of tariff pass-through arrangements would clarify investor concerns
Macro overlay: The Bank of Korea raised its base rate by 25bp to 2.75% on July 16 — the first hike since early 2023. A stronger Korean won (KRW appreciation from capital inflows) would create a modest FX headwind on SK Hynix's KRW-reported revenue, as the company invoices HBM contracts in US dollars. The current rate of ₩1,484.7/USD is weaker than the 2025 average, so the net effect depends on timing of contract settlements.
How to Access the Report and Call
- Preliminary release (July 22, ~4 p.m. KST): Available at news.skhynix.com and SEC EDGAR (6-K filing)
- Full earnings call (July 29, 9:00 a.m. KST): Live audio webcast at ir.skhynix.com in Korean and English; archive posted same day
- Financial statements: Full IFRS consolidated financials in English typically published within a week of the call date
This article is journalism, not investment advice. SK Hynix (SKHY, 000660.KS) Q2 2026 earnings estimates are analyst forecasts and may differ materially from actual results. All Korean won figures are approximate at July 16, 2026 reference rates.
Sources: SK Hynix 1Q26 Financial Results · SKHY Q2 Earnings Call 6-K Filing · SK Hynix Q2 2025 Actual Results · KIS Semicon Q2 Estimate Revision · BigGo Finance Q2 2026 Preview · CNBC SK Hynix Q1 2026